$COMP daily chart - CompoundCOMPUSDT at the daily chart.
Strong Support at 40.82$ and it's not just a normal support, it is a golden Fibo 0.618 level and uptrend that started from last June 2023.
First Resistance at 44.97$ but it's better to make your first target at 44.60$ because there is a 200MA line at 44.70$
The rest of the resistance : 44.97$ - 52.6$ - 67.7$ - 87.5$ - 112.5$
If the token loses 40.80$ support, the first targeting area will be around 36.7$ and next support at 29$ - Strong and important support at 20$
Disclaimer : Do your own research and trade at your own risk.
Follow for me
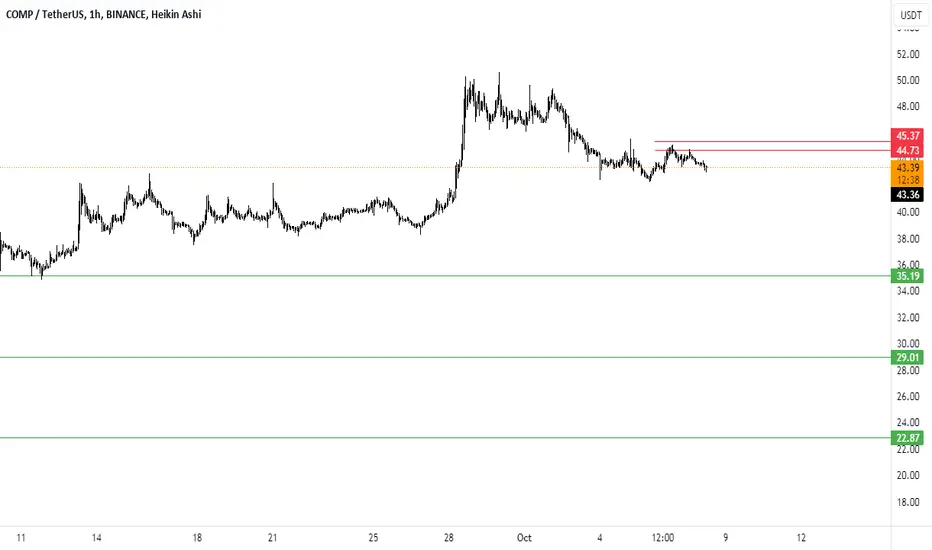
COMPUST trade ideas

💡Trade Idea #COMP/USDT:#Compound has established a bullish market structure, signaling its readiness for a potential upward rally when observed on the daily timeframe. Waiting for a breakout.

Compound USD long possible 150% gainsComp looks ready bust out to all-time highs it is incredibly volatile so make sure you set your stop loss accordingly ...
However if it can manage to break past resistance marked on chartIt's likely going to make all time highs as long as Bitcoin doesn't decide to commit suicide

compusdt short positionsRTM demand
choch bearish is happend so the price is going up to the level which made choch

COMP next accumulation phase before bull runBINANCE:COMPUSDT
✅Before we start to discuss, I would be glad if you share your opinion on this post's comment section and hit the like button if you enjoyed it.
Thank you.
Around 460 days we are in downtrend! Last time for Comp was enough 145 days for accumulation stage before pump, lets see how it plays this time. Sellers and buyers local block I marked red and green! If we out over 72$ its will be good sign for continuation, but honestly even BTC reach 29 I think at 70-72 Comp meet strong sellers orders and going back to test even 30$. Everything can happen.
Hope you enjoyed the content I created, You can support with your likes and comments this idea so more people can watch!
✅Disclaimer: Please be aware of the risks involved in trading. This idea was made for educational purposes only not for financial Investment Purposes.
* Look at my ideas about interesting altcoins in the related section down below ↓
* For more ideas please hit "Like" and "Follow"!

COMP: Approaching ResistanceCompound (COMP) technical analysis:
Trade setup : We wait for price to break back above $47 resistance and 200-day moving average (~$45), which could signal resumption in Uptrend with near-term upside potential to $60 resistance.
Trend : Downtrend across all time horizons (Short- Medium- and Long-Term).
Momentum is Mixed as MACD Line is below MACD Signal Line (Bearish) but RSI ~ 50 (Neutral). MACD Histogram bars are rising, which suggests that momentum could be nearing another upswing.
Support and Resistance : Nearest Support Zone is $36, then $30. The nearest Resistance Zone is $47, then $60, and $70.

COMP Looking to breakout from the double bottomCOMP is currently facing 4hrs TF resistance and if it breakout from 44.42 we can see a good run up to 52.99
Keep your eyes on the breakout from the neckline of the double bottom
Follow for more market update

CompusdtCompound
About to break downtrend
50% to the range high
Coins starting reversal patterns around here

COMP : NEXT PATTERNHello.
Pattern on Comp. ALL infos on chart.
Target 83-86 dollars. Then a big dump to 56-53 dollars.
Ultimate Target if M pattern is confirmed : 30-33 dollars.
Good luck all.

The Art of False Breakouts + RSI: COMPOUND! 📉🚀Trading is an intricate game of psychology, and understanding false breakouts can be the key to success. Let's delve into COMP, where false breakouts played a pivotal role in recent price action. 📉🚀
Closer look to Fakeout :
Deconstructing False Breakouts
False breakouts are like crafty illusions, luring traders into making premature decisions.
COMP, a cryptocurrency known for its volatility, recently demonstrated how these maneuvers can shake the market.
From False Bottom to False Top
COMP first tricked traders with a false breakdown from the lower range, inducing panic.
But as if by sleight of hand, it quickly shifted gears, delivering a false breakout from the upper range, catching many off guard.
Trading Wisdom: The Lesson Here
The case of COMP underscores the need for cautious trading, especially in volatile markets. Recognizing false breakouts can help you avoid unnecessary losses.
Strategies involving stop-loss orders and thorough research can be your shield against these tricky moves.
Conclusion: Mind the Illusions
COMP's recent shenanigans emphasize the significance of identifying false breakouts. This knowledge can give traders a substantial advantage and help them navigate the turbulent waters of crypto trading.
📊 Trading Strategies | 🧠 Psychology | 📈 Price Action | 💡 Insights | 🌐 Cryptocurrency
❗See related ideas below❗
Share your thoughts in the comments! 💚📉💚


🔥COMP Is At a Channel Mid: What's Next? 2 Options!Compound grew by +180% from bottom to channel top. It's very volatile altcoisn which can impress traders and investors, but now it's indise the channel mid.
The first confirmation of the upcoming growth will be the close of the Weekly candle above the mid of the channel. Usually, it becomes good support.
💥The targets in case of fall or close above the channel are diffrent. If the price fall to the channel bottom, the target will be at the top by +180%.
If the price close above the mid channel, the targets will be at the channel top by +70% and the order flow +229%.
I want to remind you, that these targets are only for the local growth. It will skyrocket during the full-fledged bull market!
like❤️ and follow
Check the links and get a BONUS🎁 from me👇

compI think it should be done to buy in the lower green lines, because in my opinion, it can still form a better floor

COMP Long Setup with PA, Max TP %20OKX:COMPUSDT.P
There is an obvious clear bullish Elliot Wave, however we do not know the exactly where the 4th wave ends? Therefore to open position we need a solid bullish price action min in 1H time frame. After that it will be very easy to manage the position.
Good Luck Everyone!


Spotlight on COMP: Imminent Breakout and Bullish Momentum🚀 💎Yello Paradisers! Get ready for a thrilling venture with COMPUSDT. We've detected a triumphant escape from the descending channel, paving the way for a potential bullish ascent.
💎From our prior assessments, we witnessed the metamorphosis of demand into supply, with COMP revisiting the falling channel support.
💎At this time, the substantial volume in VRVP is signaling a probable bullish trajectory in the near future. Overcoming the monthly resistance is poised to reinforce this ascending momentum.
💎Conversely, if the price breaches the 45.45 level, it could amplify the bearish momentum, making it plausible for the price to revisit the former support level.
💎Trade with caution and implement stringent stop-loss measures. Stay vigilant to the evolving market conditions and keep abreast of further insights!

📉 COMP/USDT Signal Alert: Balancing Act! 📈Critical Levels to Watch:
🚀 Breakout Point: $50.14
🔥 Bullish Targets: $54.58 and $57.22
🐻 Bearish Zone: Below $46.47, with potential drops to $37.35 or $36.27
👁️🗨️ Analysis: COMP/USDT is at a pivotal juncture. Keep your eyes peeled for these key levels:
🟢 Bullish: If it breaks $50.14 and holds a 15-minute candle above this level, we're aiming for the skies!
🔴 Bearish: On the flip side, a drop below $46.47 could send us on a downward journey.
📢 Trade Strategy: Patience is key! Set your alarms at $50.14 and $46.47. Once triggered, make your move. Enjoy the ride!
Bitxer's insights are your guide to navigating the crypto seas. 🌊📊

COMP/USDT Downward Momentum ?? Compound Today Analysis Hello Paradisers, Here's one to watch!
💎COMP faced a setback after reaching the Bullish OB (Order Block) Zone, subsequently testing the $45 supply region.
💎Notably, after touching this supply point, COMP experienced a sharp decline. It's likely that COMP will revisit the Bullish OB zone to fill the existing long wick.
💎Should the Bullish OB zone fail to hold and break, our eyes should be on the robust demand zone, where significant buying activity is anticipated.
💎My intuition suggests that if COMP reaches this strong demand zone, it might just be a liquidity sweep followed by a vigorous rally. I'd advise purchasing at the white line, but always with prudent money management.

COMP: Unraveling the DeFi AdventureCOMP is the native governance token of the Compound protocol, which is a decentralized lending platform built on the Ethereum blockchain. As a DeFi (Decentralized Finance) project, Compound allows users to lend and borrow cryptocurrencies by providing collateral. COMP token holders have the power to propose and vote on changes to the protocol, influencing its governance and development. Its uniqueness lies in its role as a governance token, enabling users to have a say in the direction of the platform. As of the latest data, COMP's market cap stands at approximately $2.5 billion, and it is ranked among the top 50 cryptocurrencies by market capitalization.
Where have we come from?
Downtrend and Key Resistance:
Since September 7, 2021, COMP has been experiencing a downtrend, marked by four unsuccessful attempts to break the key resistance at $530.15. This resistance level holds significant importance for the asset's future price action.
Major Support Formation:
On June 18, 2022, COMP found major support at $26.15, leading to a swift retracement back to $28.75, representing a 10.25% swing to the upside in a single trading day. This support zone altered COMP's direction and pushed its price near the resistance at $71.15, leading to a period of sideways movement before a temporary break of the previous support, resulting in a lower low.
Breakout of Downtrend:
Despite the lower low indicating a bearish narrative, the robustness of the previous support at $26.15 and $28.75 propelled COMP to skyrocket, breaking the established long-term downtrend.
What's Next?
Resistance Level and Areas of Interest (AOI):
Since breaking the downtrend, COMP has seen a 117% rise to the resistance level at $79.55, which has been an area of interest since early May 2022. Understanding these key areas provides insights into possible future price movements.
Key Levels to Watch:
Currently, COMP has yet to break and hold the key level at $71.15, as well as the further resistance at $79.55, indicating potential weakening of the bullish sentiment. A break and sustained hold of the $71.15 level is crucial, as it plays a significant role in traders' psychology and valuations.
Where Do We Sit?
ROBO Advisor Sentiment:
ROBO advisors are bullish on major longer-term timeframes (weekly, daily, 3-hourly). However, they are showing signs of weakness on lower timeframes like the 45-minute and 15-minute intervals.
50-Day EMA:
The current 50-day Exponential Moving Average (EMA) is above $55, and it is plausible to expect a revisit of this level in the coming days or weeks.
Urgency for Upside Movement:
Although the majority of the chart and ROBO advisors indicate a bullish sentiment, action is required sooner or later if COMP is to continue moving upwards.
As with any investment decision, it is important to consider multiple factors, conduct thorough research, and manage risk effectively. Technical analysis offers valuable insights but does not guarantee future price movements.

Spotting Promising Signals for a COMPUSDT Rally💎The current long-term price action of #COMPUSDT presents an enticing opportunity. Taking a step back and examining the broader context, we can observe a compelling narrative. Following the formation of a double bottom pattern, there was a monumental breakout above the downtrend trendline in June. During this bullish surge, the price experienced an impressive 269% ascent, only to later retrace by approximately 80%.
💎What captures our attention is the intricate price action surrounding the 78.6% Fibonacci support level, where #COMPUSDT has meticulously crafted a double bottom formation. This pattern underscores the presence of robust demand, significantly enhancing the prospects of an impending upward movement.
💎Yet, at this juncture, #COMP has encountered a challenge in the form of a descending trendline, a barrier that must be surmounted for the price to sustain its upward trajectory. This is precisely what the MCP team eagerly anticipates—a breakout from this trendline that could trigger substantial price gains. In the event of such a breakout, we anticipate a remarkable price increase ranging from 65% to 80%. Notably, this aligns with the positions of two pivotal double Fibonacci resistance levels at $60.65 and $66.00.
💎Paradisers, the cryptocurrency market is heating up, and we are committed to keeping you informed about the most compelling opportunities that emerge daily. Stay tuned! 🚀📈

COMP shortCOMP broke trough off the lower boundary of ascending channel. Asset broke trough the support level. Bearish movement to support level at 38.15 is expected to happen.

$COMP will pump soon NYSE:COMP ANALYSIS
NYSE:COMP ’s price is losing 60% from ATH at 87%. Now NYSE:COMP is facing strong horizontal support at $39.6 and NYSE:COMP ’s volume is descending too. I want to see a bullish engulfing to confirm the bullish momentum. #RSI is suited to the neutral regions but #MACD crossover is losing the bearish momentum.
