Comp weekly butterfly pattern off all time lows bullish butterfly on comp just above all time lows with a bat pattern in the rsi ,first positive momentum on weekly macd , above the most critical level etc
below these lows no data exists this is one of the best looking charts and no brainer trades ive ever seen if not the best in terms of probability of success and reward to risk.
cant wait to press the watch button on this trade in a few weeks time
insane reward to risk ratio with take profits along the way
COMUSD trade ideas

Video: COMPUSD Looks Very Similar to Doge. Here's what to watch
In this video I'll show you what I've spotted on the COMPUSD chart and what I would be watching/waiting for before I took an entry.
⛓️ 🔗 Useful Links 🔗 ⛓️
Link to Static Posts:
Dogecoin - www.tradingview.com
CompUSD - www.tradingview.com

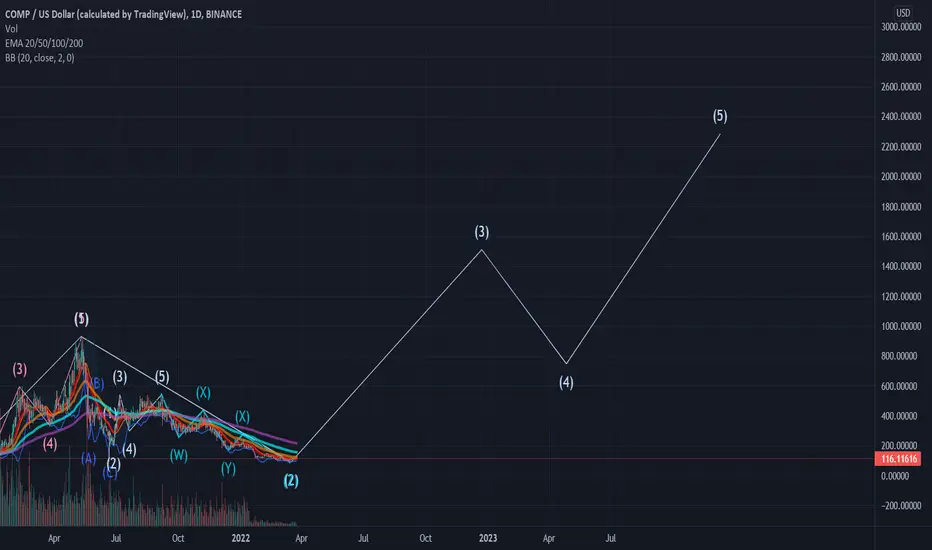
COMP/USDTesting/tracking elliot wave theory. Please do not trade off idea without S/L. Not financial advice.
The start of this count is around the $84 area ( wave 1) and we've reached the bottom of $99 or so (wave 2), I highly doubt we will go anylower than $99 but if we do, this chart is still valid as long as we're above $85.
Wave 1 - $900
Wave 2 - $99?
Wave 3 - 1500??
Wave 4 - 750??
Wave 5 - 2222??
Will update as price targets reach or chart becomes invalid.
COMPUSDLONG-TERM: Weekly classic bullish divergence , double bottom , falling wedge breakout, PCZ of bullish butterfly . (not financial advice)
tailoring position sizes for looser stops is important*

Compound Long - triangle breakout setupAs we can see COMP has been in a bear market since mid may 2021. Having reached a support zone always respecting the major weekly trendline we could se a pump and consequent break of the triangule structure. RSI and MFI at low levels showing possible reversal of the bearish pressure. Yellow zone marked on the graph is a possible Fib retracement zone
The project itself is base on De-Fi lending protocols and has a relatively great lending and repayment volume, that a plus for this trade. Also considering the imminent pump on BTC every alt coin tends to pump afterwards so this could be a great zone to enter in.
I will DCA between 112-91 and take profits at 227-253
𝗡𝗢𝗧 𝗙𝗜𝗡𝗔𝗡𝗖𝗜𝗔𝗟 𝗔𝗗𝗩𝗜𝗦𝗘

Comp Long Swing | COMPUSDT | LONG @ 143 - 147 | TP @ 148, 150, 152, 154, 156 | SL @ 130 | PATTERN = BULLISH MACD CROSSOVER | COINBASE |
Swing trade idea. Kindly follow targets and stop loss. Will update with new targets once all 5 are achieved.
COMPUSD (4H) Bullish reversalHi Traders
COMPUSD (4H Timeframe)
Waiting for the upward break of 137 resistance level, which will complete a bullish trend reversal pattern to go LONG. Only the downward break of 112 would cancel the bullish scenario.
Trade details
Entry: 137
Stop loss: 112
Take profit 1: 150
Take profit 2: 174
Score: 5
Strategy: Bullish reversal

Compound 1/10 of the ATH!butterfly harmonic pattern:
X=$1763
AB=0.78 XA
BC=0.88 AB=$107
0.78 BC=$548
0.88 BC=$696
0.88 XA=$1241
1.13 XA=$2630
1.6 BC=$3952
1.27 XA=$4070
1.41 XA=$6223
2 BC=$9785
1.6 XA=$11800
2.24 BC=$17293

Double Bottom on Strong Support Compound looks like it could double bottom on a strong historic support of $180.
-Volume spike on the way down to retest $180.
-Bullish divergence on the 1D time frame.
-Starting to make a higher high on the 4H time frame.

I always liked good crypto projects. But with the correct pricing. Not like inflated by scam USDT pricing.
So this penetration made me anxiously wait to rebuy around 80 USD. Patience makes the greatest fortune. Remember tat and cheers.
Invest responsibly with your own effing money.

COMP/USD (Coinbase) Weekly Falling WedgeCOINBASE:COMPUSD
Compound is showing a nice falling wedge formation. RSI is bottoming out and oversold. MACD showing bullish convergence with impending golden cross. What do you think?

COMP LongInvalidation under long term trend line.
Mean reversion target 320+
Defi 1.0 mkt outlook is pretty bleak, but down here is a good place for a spot of good news to emerge, even if it's short lived.
COMP has bounced violently in the past, many will believe it can happen again.

Compound breakout any dayCompound is on the verge of a breakout any day now. It has been consolidating since May 2021 so this next move will probably be something for the history books. There is definitely a lot of resistance overhead so this should be a very tradable altcoin with clear take profit and reentry positions. I've laid out some basic places to potentially take some profit or enter a position. However if you're less of a trader, you could just HODL until we're back near all time highs or making new highs if that occurs. Compound along with other blue chip defi projects like Maker and Aave are all incredibly undervalued right now and I wouldnt be surprised to see another 10x on them at some point this year. Good luck!


Buying COMP HereComp down 80%. I have started to average in. Don't see this going to zero and its kinda greedy to want to buy it lower at this point. Daily candle looks great so far. Lets see if there is a DEFI 2022 run. Not advise.

COMPUSDThe triangle were the COMP-token is in for months will end soon. Let's see how this plays out..

COMP i personally notice a good double bottom and a coughee it up cup and get a handle and i got in at the right time i hope even though i missed that dip that i predict is the final one, good for a doubler at least though as long as it goes like i have been told, just like another coin i called but not on social media at all as i have been away so no proof but missed that one coincides with raw fish, YUMMY!!! waiting for that one to hit sicks or 7 but probably wont and end up FOMOin @11, now back to this, end of January 350 Middle 425. More than likely as i am 2 months away from being only a year into crypto i could be wrong, i am not a financial advisor at all. i am just an aspiring yt wrapper also on Torum... XTM to the moon!!!

COMPUSDT - Falling wedgeProbably a bullish setup on the 1H COMPUSD(T). Most of time this type of pattern will breakout to the upside. Let's watch this..
Compound (COMP) - December 25Hello?
Welcome, traders.
If you "follow", you can always get new information quickly.
Please also click "Like".
Have a nice day.
-------------------------------------
(COMPUSD 1W Chart)
Above the 250.56132 point: the uptrend expected to continue
Keeping the price above the 250.56132 point is paramount.
If it declines at this rate, it is expected to enter the mid- to long-term investment area.
The resistance range is 405.76617-490.76413.
-------------------------------------
(COMPBTC 1W chart)
To turn into an uptrend, it must rise above the 0.00657 section.
In particular, it is expected that the upward trend will accelerate when the volume profile section formed in the 0.00657-0.00876 section is passed.
To break out of the downtrend line, we need to see if it rises above the 0.00528 point.
------------------------------------------
We recommend that you trade with your average unit price.
This is because, if the price is below your average unit price, whether the price trend is in an upward trend or a downward trend, there is a high possibility that you will not be able to get a big profit due to the psychological burden.
The center of all trading starts with the average unit price at which you start trading.
If you ignore this, you may be trading in the wrong direction.
Therefore, it is important to find a way to lower the average unit price and adjust the proportion of the investment, ultimately allowing the funds corresponding to the profits to be able to regenerate themselves.
------------------------------------------------------------ -------------------------------------------
** All indicators are lagging indicators.
Therefore, it is important to be aware that the indicator moves accordingly with the movement of price and volume.
However, for convenience, we are talking in reverse for the interpretation of the indicator.
** The MRHAB-O and MRHAB-B indicators used in the chart are indicators of our channel that have not been released yet.
(Since it was not disclosed, you can use this chart without any restrictions by sharing this chart and copying and pasting the indicators.)
** The wRSI_SR indicator is an indicator created by adding settings and options to the existing Stochastic RSI indicator.
Therefore, the interpretation is the same as the traditional Stochastic RSI indicator. (K, D line -> R, S line)
** The OBV indicator was re-created by applying a formula to the DepthHouse Trading indicator, an indicator disclosed by oh92. (Thanks for this.)
** Support or resistance is based on the closing price of the 1D chart.
** All descriptions are for reference only and do not guarantee a profit or loss in investment.
(Short-term Stop Loss can be said to be a point where profit and loss can be preserved or additional entry can be made through split trading. It is a short-term investment perspective.)
---------------------------------

COMPUSDCOMPUSD is trying to break the line of resistance. On the 1D also possible positive divergence is forming.. Volume is also I increasing. COMPBTC and COMPETH are also in the lowest price-ranges..
There's a lot of resistance but when COMP goes, it goes. And after months of a downtrend this can be a nice reversal / buying opportunity

MY NOT SO MINIMALIST ANALYSIS FOR COMPOUND$COMP (INDICATORS INCLUDED)
11.02.21
1243H +8 SINGAPORE
ALERT: ABOUT TO COIL UP - ENTRIES, PARTIAL EXITS, EXITS, and MAXIMIZED AREAS OF VALUE
THIS IS AN AREA OF OPPORTUNITY: A ZONE FOR AN ENTRY.
Accumulation looks healthy. I think it will not break resistance yet until we see volume increase further. COILING towards STRONG SUPPORT and then BOOM!
You may enter now, It can make a sharp small dip DO NOT FUD.
Disclaimer:
The findings of the following analysis are the sole opinions of the publisher of this idea and should not be taken as a piece of investment advice.
"FOLLOW THE WHITE RABBIT!"
Just Follow the TOPS and BOTTOMS of the BOXES as a GUIDE
HOW TO USE THIS MINIMALIST CHART
Created on a MONTHLY, WEEKLY & DAILY Analysis (The Dynamics of the Market.)
It is designed for SWING TRADES at the BOTTOM. I do not SHORT, though, you can still use it.
TARGET ZONES IDENTIFICATION
The LARGE BOXES (Tops and Bottoms) are MAJOR pivot points that will occur sometime in the future. While the SMALL BOXES (Tops and Bottoms) are MINOR pivot points.
These can be entries to a BUY/ SELL POSITION, EXIT/PARTIAL EXIT/TOP-UP AREAS
and if you wish to hold longer for a MAXIMUM TARGET EXIT AREA OF VALUE -CONSERVATIVE (If price action conditions are right.)
At times I include WAY BEYOND PARABOLIC Price TARGETS depending on The Character of the Market.
Watch out for your Volume, Chart Patterns, Candlestick Math, FIB COILS (ABC), Price Action, FIB LEVELS, Market Dynamics, and especially trading psychology.
Wishing you all The Best Trades and Thank you all for your Appreciation and Support of My Work.
Much thanks to My 3 Mentors!
Note:
Master your Trading Discipline
, Trader's Psychology and Institutional Psychology
Vive Le Austist!

COMPUSD in downwards channelProbably time to break out of this channel. Volume is increasing and it seems COMP has already bottomed. Let's see..
possible bouncebackpretty self explanatory, the W is forming and it's going back up to a new resistance soon.
