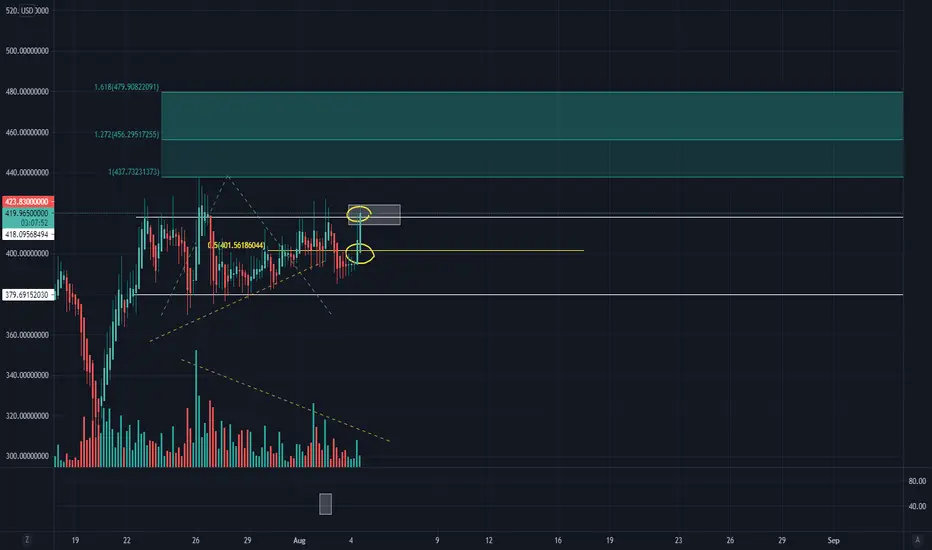
COMP: VSA Looking GoodEntered yesterday at 411.27. Taking profit and gunning for the .272-.618 territory. VSA looks promising. Let's see if it retests TR-R or just barrels straight through to fibland.
Like big wins and big money? Got strong hands? Good! Same here.
I'm a full-time cryptocurrency swing trader (since 2017) and regularly seek out the most lucrative swings available on all the major exchanges.
My win rates are between 80-85%. Follow me on TradingView and see for yourself.
All my charts are clean, straightforward, and easy to follow. No junk, no needless indicators -- just volume & spread analysis with simple Fibonacci target zones.
Good luck and safe trading!
COMUSD trade ideas
COMPUSD Upward ContinuationAn underdog coin, with huge potential
As can be seen on chart an inverse head and shoulders has pushed the price above a curved resistance
this will most likely lead to further upward continuation as it is in the lower range of the main channel plotted
only 1 test of 1.618 led to a breakout to 2.618
Hopefully only the 1 test at 2.618 we have seen will be the only test at this level, and a breakout to 3.618 will proceed

Altcoins: bulls take directional controlThe altcoin space is capturing our attention with a series of impulsive price movements that could be used to anticipate other frontline cryptos for the coming 4-6 weeks. In this video, we analyze the soaring prices of SNX, SAND, YFI, CRV, MKR, AAVE, CEL, and COMP.

Compound (COMP) - July 26Hello?
Welcome, traders.
By "following", you can always get new information quickly.
Please also click "Like".
Have a nice day.
-------------------------------------
(COMPUSD 1W Chart)
If the price holds above the 250.561321 point, we expect the uptrend to continue.
(1D chart)
It remains to be seen if the 369.536000-405.766170 section can find support and move up.
It remains to be seen if it can move above the 405.766170 point and continue its uptrend.
If it declines from the 277.661808 point, it may enter the mid- to long-term investment zone, so careful trading is required.
-------------------------------------
(COMPBTC 1W chart)
If the price holds above the 0.010745 point, it is expected that the uptrend will continue.
(1D chart)
It remains to be seen if the 0.010608-0.011425 zone can support and move up.
If the price holds above the 0.011425 point, it is expected that the uptrend will continue.
It remains to be seen if the green color of OBV in the volume indicator can remain elevated.
Green in OBV means buying.
In the CCI-RC indicator, since the CCI line is located in the range of -100 to +100, the price is most likely located in the box section.
It remains to be seen if the CCI line can accelerate the uptrend by moving above the EMA line and above the +100 point.
------------------------------------------
We recommend that you trade with your average unit price.
This is because, if the price is below your average unit price, whether it is in an uptrend or in a downtrend, there is a high possibility that you will not be able to get a big profit due to psychological burden.
The center of all trading starts with the average unit price at which you start trading.
If you ignore this, you may be trading in the wrong direction.
Therefore, it is important to find a way to lower the average unit price and adjust the proportion of the investment, ultimately allowing the funds corresponding to the profits to regenerate themselves.
------------------------------------------------------------ -----------------------------------------------------
** All indicators are lagging indicators.
Therefore, it is important to be aware that the indicator moves accordingly with the movement of price and volume.
However, for the sake of convenience, we are talking in reverse for the interpretation of indicators.
** The wRSI_SR indicator is an indicator created by adding settings and options to the existing Stochastic RSI indicator.
Therefore, the interpretation is the same as the traditional Stochastic RSI indicator. (K, D line -> R, S line)
** The OBV indicator was re-created by applying a formula to the DepthHouse Trading indicator, an indicator disclosed by oh92. (Thanks for this.)
** See support, resistance, and abbreviation points.
** Support or resistance is based on the closing price of the 1D chart.
** All descriptions are for reference only and do not guarantee a profit or loss in investment.
Explanation of abbreviations displayed in the chart
R: A point or section of resistance that requires a response to preserve profits.
S-L : Stop Loss point or section
S: A point or section where you can buy for profit creation as a support point or section
(Short-term Stop Loss can be said to be a point where profit and loss can be preserved or additional entry can be made through split trading. It is a short-term investment perspective.)
GAP refers to the difference in prices that occurred when the stock market, CME, and BAKKT exchanges were closed because they are not traded 24 hours a day.
G1 : Closing price when closed
G2: Opening price
(Example) Gap (G1-G2)

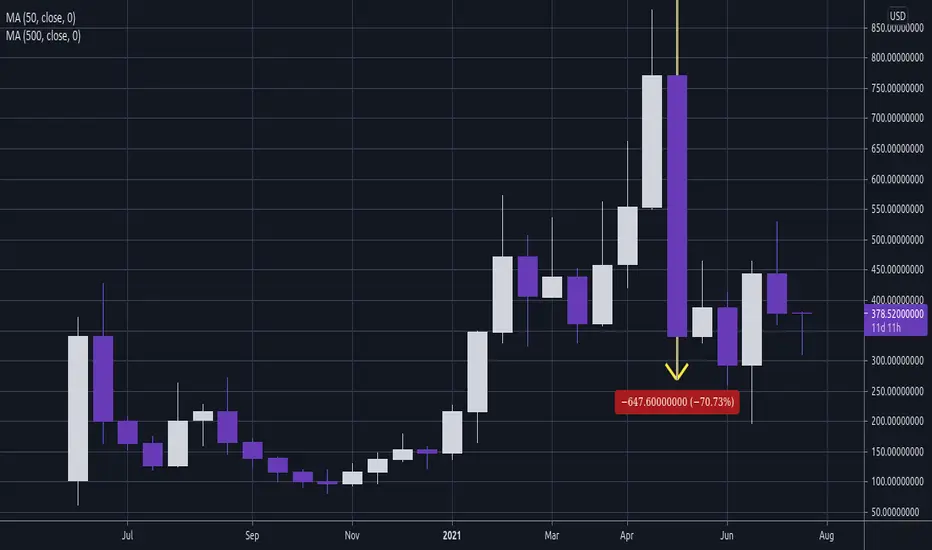
COMP - More Beraish Than OthersAs per request
COMP had it last rally late in the day and post crash has meant it suffered a 70% loss in a week. Perhaps COMP will follow a similar price direction to other coins as the bear market continues but such a sudden loss does not do good for confidence and also mean there are more potential bearish fibonacci projections.

Taking profit by moving up the SLWe are taking profits on Compound by moving up our stop loss to 350
We entered the trade on the break of the psychological level of 200. We are still targeting the ATH of 900 but decided that at 100% profit now, we should lock in 75% of it if it drops.
You can enter this trade at those levels now also and put your stop loss and take profit similar levels. Risk less than 100 to take 500.

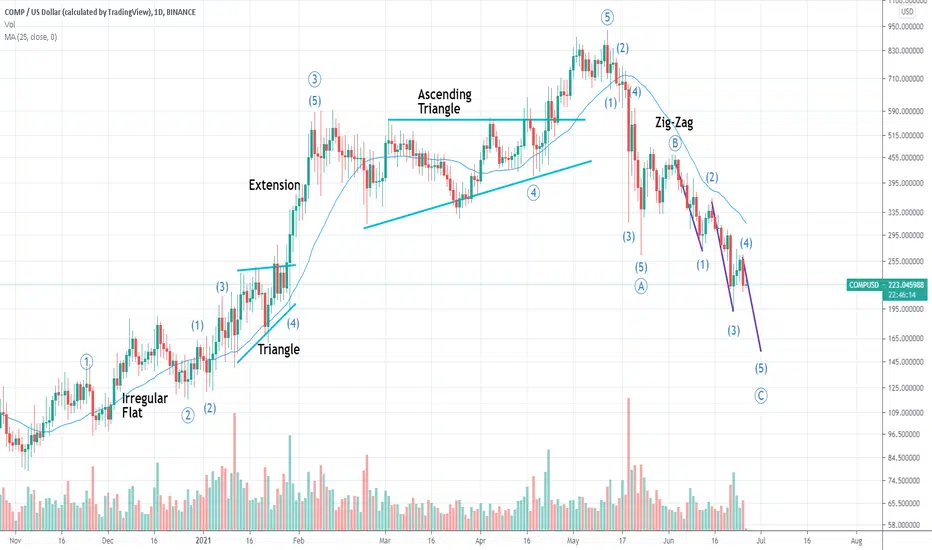
Compound: Simple Zig-Zag CorrectionCompound appears to have completed a set of 5 impulsive waves, with an extended sub-wave 5, for a first bullish wave 1. It is now correcting in the shape of a zig-zag, the most common pattern for a wave 2. Right now it is tracing sub-wave b of wave 2 and I expect a sub-wave c of wave 2 in the upcoming days that could push the price down to the $325-360 range, which would be an ideal long entry point. This range is derived from a Fibonacci retracement of between 50% and 61.8%, but the 61.8% being the most probable occurence.

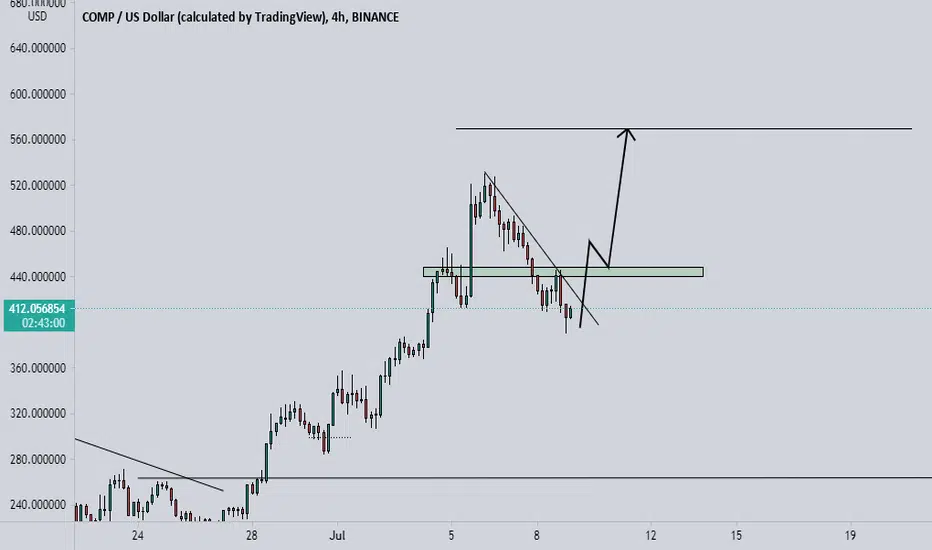
COMPUSDT - LONG SETUPSince COMP's recent bullish impulse on the daily timeframe the market has provided us with a nice correction to the 0.382 fibonacci, generally speaking after a impulse and correction you expect the market to make the continuation to the upside, on the 4hr timeframe however everything at the moment is bearish we are below corrective trendline and we have a head and shoulders formation. IF HOWEVER the market manages to break above the corrective trendline and form a new 4hr higher high and close above this previous swing high, on the retest if all other entry rules are satisfied we will be taking a nice long.
Start of a New Alt Coin Run ?This is the JK67 Strategy - Basically waiting for a Price cross above the 67 day MA on a daily chart with the 170 MA under it is a good way to build longer term big swing positions....

$COMP @ Resistance Point$COMP @ Resistance
I am super bullish on #COMPOUND however it has reached a Resistance level confirmed by the High Volume Node on the Volume Profile.


A dangerous pattern for COMPI took the impulse up, SL in the positive. Link attached.
Structure now looks like a potential running flat, that will eventually lead to new lows…
Take care

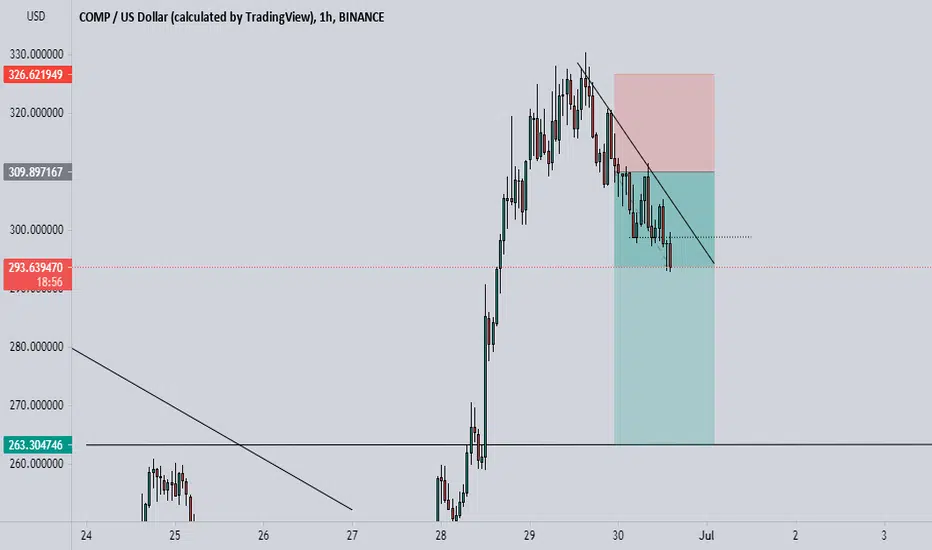
Potential Short term Short on COMP/USDTWe have some bearish divergence on Compound/USD with a lower highs being made on the RSI while Higher Highs being made on the price....
Next potential high and resistance looks like it lines up with the rising wedge, the .236 Fib, and the 300 EMA...
Looking to enter a short, from 370-380 with an exit target around 330. Also keeping in mind the BTC is also looking week and if BTC breaks down then I will just hold on to my COMP short worst case take a stop loss /stop profit in the 350 range...
If it fails a stop loss will be placed in 410 for protection of capital.

COMPUSDT - UPDATESince my analysis yesterday market is making a correction exactly as we expected, a nice scalp position we are currently running in +70% profit using 15x leverage. We will close this trade at the neckline of the W formation on the daily timeframe, then possibly look to long.
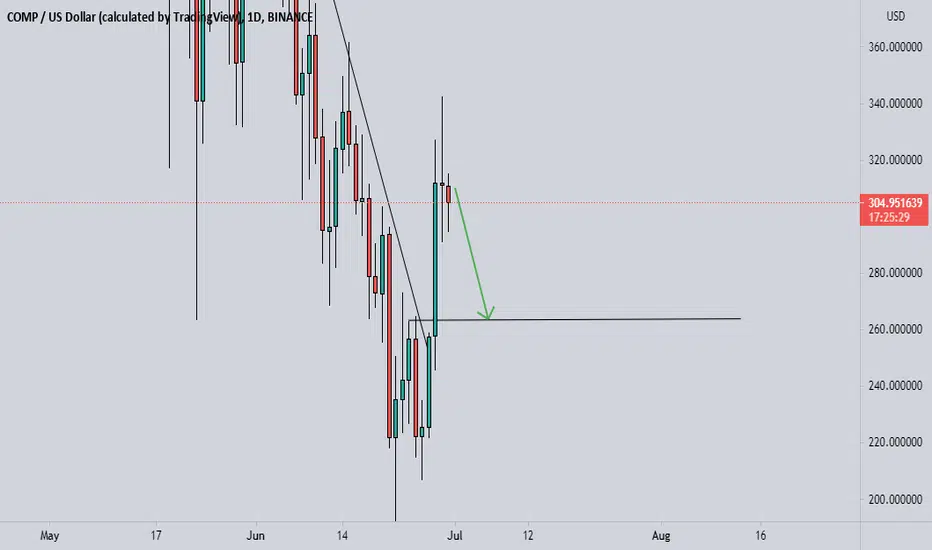
COMPUSDT - Corrective shortCOMPUSDT on the daily timeframe has a nice impulse and has broke above structure, also over extended and due a correction. Also on the daily timeframe market has formed this nice W formation in which we expect the market to complete at the neckline, we will be waiting on lower timeframes for entry rules to be satisfied BEFORE possibly looking at capitalising on this scalp short position.

where is $COMP headed? $350 or $88?$COMP has pulled back more than 80% from its all time high of over $900. The area around $240 is an important area of value. If we see further correction and pullback, the market could remain between $240 and $88 for a bit and it will not be surprising if it bottoms back near $88. On the other hand, the bearish price action over the last few weeks could finally lose some steam. $240 could act as an area of support and price could remain between $240 and $350. Watch the video to get a sense of why these numbers are important and how they create important levels. Nothing here is investment advice. Use this information as a tool to understand $COMP price action and market structure and as always please do your own research before you enter a trade.

Compound: One Last DowntrendThis DEFI lending platform is showing a clear Elliott Wave count: a gigantic primary zig zag, where there is only an intermediary wave 5 of primary c to finish. In other words, there is still -30% potential from current level, so the target would be $150. It seems like a crystal clear textbook count to me.
COMPOUND - buy setupPrice moved up in 5 waves, counting this as an impulse.
Followed by a three-waves pullback, exactly to 62%
Wait for a price action confirming the continuation to the upside.
Good luck!

Row, row, row your boat COMPUSDGently down the stream. COMP going down.
Fibonacci goals is in green, cancellation/setup rejection is in red. This is not some kind of financial advice for your portfolios, so do your own research and make your own decisions about your trading or investment related moves.

Comp - short scalpComp looks to be losing momentum and price could roll over soon.
Short on break of support.

Compound (COMP) - June 15Hello?
Welcome, traders.
By "following", you can always get new information quickly.
Please also click "Like".
Have a good day.
-------------------------------------
(COMPUSD 1W Chart)
If the price holds above the 250.561321 point, it is expected to maintain an uptrend.
(1D chart)
We need to see if it can move above the 336.093037 point to find support.
To transition into an uptrend, it needs to rise above the 369.536000 point and find support.
If the 460.343872-490.764132 section does not turn upward, it is expected that the downtrend will continue, so careful trading is required.
If it goes down, we should see support at the 250.561321 point and see if we can move along the uptrend line.
-------------------------------------
(COMPBTC 1W chart)
We need to see if we can break out of the downtrend line while maintaining the price in the 0.006573-0.011285 range.
To create a new wave, it must rise above the 0.013085 point.
If it falls below the 0.006573 point, it may take a long time to rise, so trade cautiously.
(1D chart)
We'll have to wait and see if we can move above the 0.008976 point.
If it goes down, you should check to see if it finds support at the 0.006526-0.007343 range.
To convert into an uptrend, it needs to rise above the 0.010745 point and find support.
------------------------------------------
We recommend that you trade with your average unit price.
This is because, if the price is below your average unit price, whether it is in an uptrend or in a downtrend, there is a high possibility that you will not be able to get a big profit due to psychological burden.
The center of all trading starts with the average unit price at which you start trading.
If you ignore this, you may be trading in the wrong direction.
Therefore, it is important to find a way to lower the average unit price and adjust the proportion of the investment, ultimately allowing the funds corresponding to the profits to regenerate themselves.
------------------------------------------------------------ -----------------------------------------------------
** All indicators are lagging indicators.
Therefore, it is important to be aware that the indicator moves accordingly with the movement of price and volume.
However, for the sake of convenience, we are talking in reverse for the interpretation of the indicator.
** The wRSI_SR indicator is an indicator created by adding settings and options to the existing Stochastic RSI indicator.
Therefore, the interpretation is the same as the traditional Stochastic RSI indicator. (K, D line -> R, S line)
** The OBV indicator was re-created by applying a formula to the DepthHouse Trading indicator, an indicator disclosed by oh92. (Thanks for this.)
** See support, resistance, and abbreviation points.
** Support or resistance is based on the closing price of the 1D chart.
** All descriptions are for reference only and do not guarantee a profit or loss in investment.
Explanation of abbreviations displayed in the chart
R: A point or section of resistance that requires a response to preserve profits.
S-L: Stop Loss point or section
S: A point or section where you can buy to make a profit as a support point or section.
(Short-term Stop Loss can be said to be a point where profit and loss can be preserved or additional entry can be made through split trading. It is a short-term investment perspective.)
GAP refers to the difference in prices that occurred when the stock market, CME, and BAKKT exchanges were closed because they are not traded 24 hours a day.
G1 : Closing price when closed
G2: Opening price
(Example) Gap (G1-G2)
