COPPER trade ideas

Doctor Copper and downward expantions Doctor Copper:
Impulsive downward wave. followed by recovery.
Upward sloping trendline is broken which increases the odds of further downside.
Eventually targetting covid19 lows

COPPER Pair : Copper - CU
Description :
Completed " 1234 " Impulsive Wave at Lower Trend Line of the Corrective Pattern Bullish Channel in Short Time Frame and it will Complete its " 5th " Corrective Wave at Demand Zone or Daily Descending Trend Line at Fibonacci Level - 61.80%
Entry Precaution :
Wait until it complete its " 5th " Corrective Wave and Reject

A very bullish pattern observed in cuwe have analyze the very bullish patter in forming in cu .in coming years cu can break the twice the current price.a long swing can be taken looking the monthly candle and s&r compulsory. trend is your friend .
note - not for intraday or scalping.
it is for long term accumulation and knowing about the actual trend in coming years

copper towards new 52 weeks high in 2024?The commodity has been in a corrective phase well from the beginning of 2023 which now seems to be coming to an end. This could mean new 52 week high for the commodity by early 2024.
in terms of Elliot wave structure the stock is currently in wave ii of wave 3. The up move to be looking forward to would be the wave-iii-3 which could well take the commodity price to 4.65-4.67 from the current levels.
on the downside the sept 2022 low of 3.24 should hold and not be breached for the analysis to hold.
note*- this is an educational post only

Looking at a copper short here. Copper short from this 1W level, refined to 1D and 4H.
Should work out.

Copper 26/10Pair : Copper - CU
Description :
Completed " 123 " Impulsive Waves and it will make its " 4th " Wave at Fibonacci Level - 38.20% / 50.00%. Rising Wedge as an Corrective Pattern in Short Time Frame and Formed " wxyx " Corrective Wave and will make its " z " wave at Daily Descending Trend Line
Entry Precautions :
Wait until it Breaks UTL / LTL and Retest

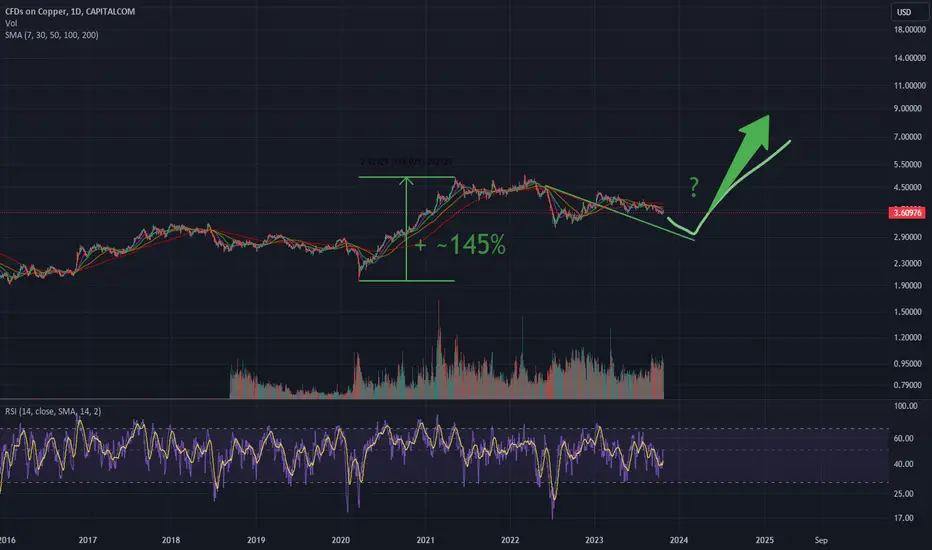
Could Copper Repeat Its Growth Pattern?Just a thought: if copper behaves as it has before, we could see it at $7-$8 per pound.
copper usd- mentoringopper speculative view
weekly on the way to tests major area since first time it was there abou at 2006, it looks bearish like a huge inverted cup&hundle on weekley
but to me it looks more like a retests of the support
and in strange feeling im leaning that it will folow orange juice and coffe
basicly the food and metals are getting more expensive in the world .
all theory will be demolished if price close and retest under 3.25645 area
look for short if close under 3.54426 area
look for long if close above 3.56159 area
***
Tolerance will reach such a level that intelligent people will be banned from thinking so as not to offend the imbeciles- F.M.dostoyevsky

COPPER - CU 20/10 MovePair : Copper - CU
Description :
Falling Wedge as an Corrective Pattern in Long Time Frame and Breakout the Upper Trend Line and making its Retracement in a Corrective Pattern " Bearish Channel " in Short Time Frame. Completed Impulse and Correction " ABC "
Entry Precautions :
Wait until it Breaks and Retest UTL

copper - mentoringcopper speculative view
weekly tests major support area .it looks bearish and kinda on the way to create a descending triangle on weekley
but could be retest of the support since 01.2021
all theory will be demolished if price close and retest under 3.54941$ area
look for short if close and rejects 3.54941 area
look for long if close and holds 3.63642 area
***
Tolerance will reach such a level that intelligent people will be banned from thinking so as not to offend the imbeciles- F.M.dostoyevsky


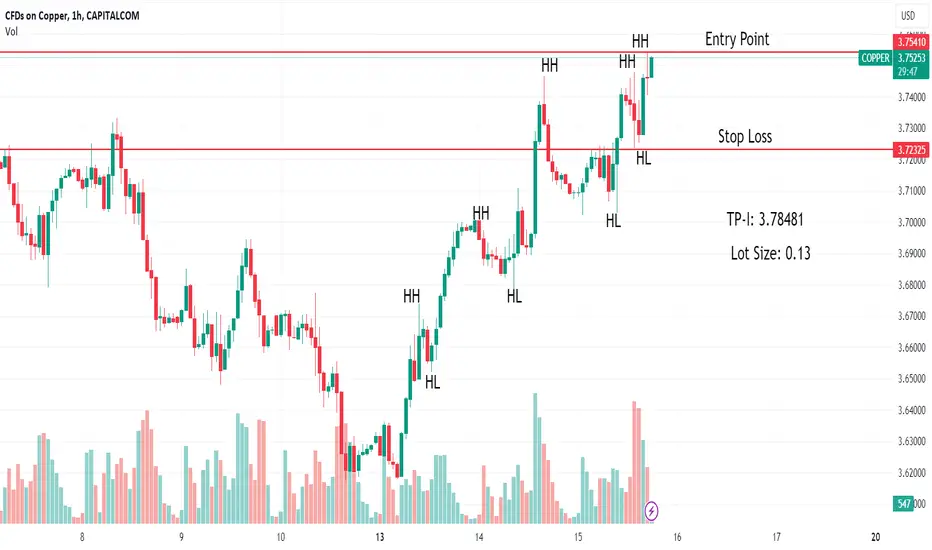
90RR Trade for CopperIt seems like the bottom might be in for Copper.
Numbers on the right for entry and stop loss.
To be more conservative you could place the SL below the purple zone but your RR will be lowered.
35% gain with no leverage targeting $4.85.

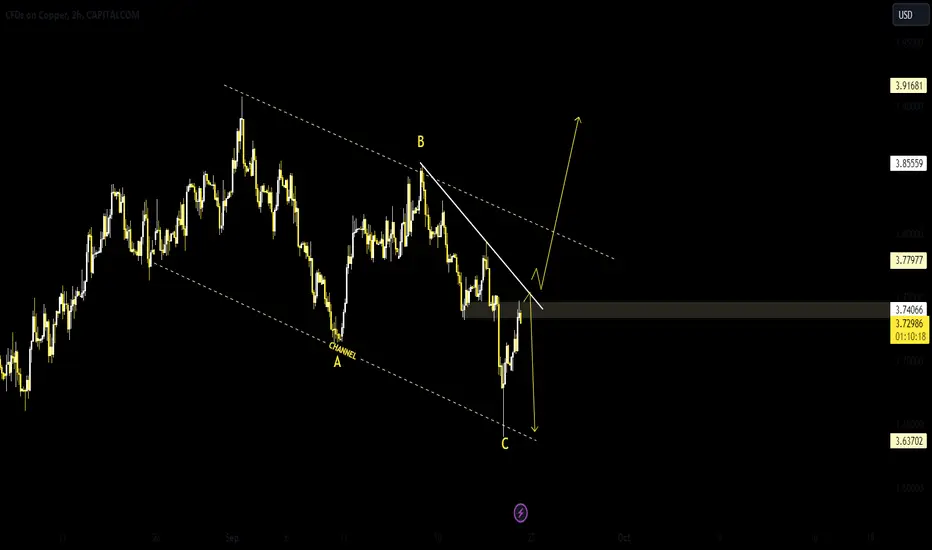
Copper Next Move Pair : Copper CU
Description :
Falling Wedge as an Corrective Pattern in Long Time Frame and Rejection from the Lower Trend Line to Complete its Corrective Waves " ABC " after Impulsive Waves. Bullish Channel in Short Time Frame and Rejection from Lower Trend Line after " B " Wave
Precautions :
Wait until it Breaks Bullish Channel or Rejects from Upper Trend Line

Dr copper potential more downside moveHello traders, lets take a look at copper which testing an important resistance area and see what can possibly happen and what are the consequences of possible bearish move in other markets like us equities.
first lets talk technical, price overall bearish Daily move in copper formed a standard #head_and_shoulder pattern in form of consolidation in downtrend move and as we know this chart pattern in the middle of a move showing continuation. As it can be seen price formed clear H&S pattern and now forming possible LH at key resistance area below Daily EMA and at the 4H timeframe 200 EMA. more importantly price failed to close above 3.80$ in the past 3 days.
Also we know that copper as one of the most important commodities is very sensitive on economic data, and since central banks are in raising interest rate campaign in order to take control inflation this can be interpreted as lower economic growth and as a result les demand for industrial commodities like copper which can bring prices lower.
so now obvious chart pattern and a valid downtrend, price testing important resistance area and failed to break above it and more importantly we have fundamental aspect inline with technical analysis which all together gives good odd to find a trigger to short.

Copper - has a history of crashing violently.As a industrial metal
When the economy slows
the price of copper nosedives
as we saw last summer when that neckline was breached
Can we see the same again? sure
But electric cars???
What of Tesla . Rivian, BYD
makes you wonder, hey?

Dr. Copper has a PHD in ECONOMICSBEAR FLAG?
The target would make a trendline from our two major demand destroying events
08 & Covid Crash
Listen to Dr. Copper when he speaks

COPPER 02/10 MovePair : CU Copper
Description :
Symmetrical Triangle as an Corrective Pattern in Short Time Frame and Breakout the Lower Trendline and Completed the Retracement after Impulsive Waves and Correction " wxyxz " , If it Breaks the Lower Trendline of the Correction " Bearish Channel " then sell

CopperJust a pure technical trade. a broadening structure on a bear pole. with a nice little continuation pattern to start the downside move.

Copper ~ 2H Intraday Chart (Sept-Oct)CAPITALCOM:COPPER chart mapping/analysis for short-term & intraday trades.

Copper ~ Daily Swing Chart (Sept-Oct)CAPITALCOM:COPPER chart mapping/analysis for med-long term swing trades.

CU Copper 22 / 09 MovePair : CU - Copper
Description :
Impulse Correction Completed and it will again make its Impulse in a Corrective Pattern Bearish Channel in Short Time Frame. We have Break of Structure if it breaks the Upper Trend Line then Buy and If it Rejects from the Demand Zone then Sell