COPPERI love Copper. Using the Fib tool you can see some market structure that gives up promising target points.
COPPER trade ideas

Copper Long - Small PositionBeen in this trade since 15th May.
Not been a great trade as struggled to go higher.
Risk is on 0.49% as it is, but even so, not much point giving more away as dont think I want to hold onto trades for too long, if they are not going anywhere or I don't have a strong fundamental bias.

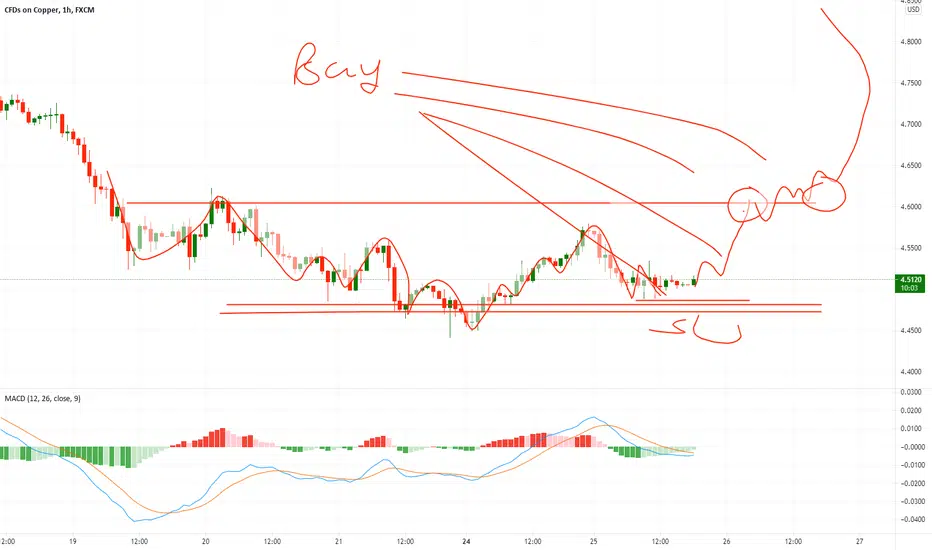
COPPER (XCU/USD) – Week 22 – New top on the cards.In our previous analysis, we expected Copper to test the support level before resuming the bullish trend. Instead, the price started the bullish move without testing the support level.
In this context, we expect a pullback to occur around the orange trendline that will act as a trigger for a bullish move that will break the previous high.
Trade with care.
Best regards,
Financial Flagship
Disclaimer: The analysis provided is purely informative and it should not be used as financial advice. Remember that you need a plan before you start trading; so, take this knowledge and use it as a guidebook that will ultimately help you understand the market and easily predict your next move.

COPPER forming distribution phase for short10th May daily key reversal bar dictating further weakness in copper. 12th & 18th May also showing weakness ahead. price forming distribution phase to short copper. 4.7550-7860 supply zone for short target 4.5220.

COPPER (XCU/USD) – Week 21 – Targeting the support.In our previous analysis, we expect Copper to start a bullish move and break the top. Instead, the price has fallen into a deeper correction.
In this context, in the coming days, we are expecting a slight price increase towards the resistance area, before making another drop, having a chance to reach the support.
Trade with care.
Best regards,
Financial Flagship
Disclaimer: The analysis provided is purely informative and it should not be used as financial advice. Remember that you need a plan before you start trading; so, take this knowledge and use it as a guidebook that will ultimately help you understand the market and easily predict your next move.

do you want to gain from four dollar to fourty dollar ? 💲😉😎🧐guys if you want to buy copper from low watch this video and gain from low to high

New trading Strategy upgrade -Hi traders, this is my trading idea and my trading strategy is Price Auction. I trade on daily chart only and find my entry opportunity on H1 or H4 chart. I don't do intraday trading such as M1- M30 chart that is very headache and stressful to keep my eyes on the screen all the time with little profits. we need a relax and happy trading with happy ending on each trade. We open and hold positions for at least 1-3 weeks for aiming at gaining at least 20% profits on each trading. My chaos drawing is not to predict and guess the further, it is my plan where we are on the chart and how and what we shall trade on our trading plan. Your comments are highly welcome.
Please following up my idea last week.


COPPEROpportunity to watch in Copper.
Possible impulse for Long.
Price is a bit below it ATH, but, before dump, it must clear the path.
Let me know what do you think. And thumb up if you find this is good content.
Peace and Joy!
Crypto SolArb

COPPER-Seems 5)th wave for C) completed and we are in bearish...Dear friends,
Don't follow me blindly...what i am sharing here, is my knowledge not signals
I am sharing my view through Elliott waves from past 4 yrs....i learned tons and tons here and market taught me lot and still teaching and i am listening to the market...and i am getting a lot of PM's regarding NEGATIVE COMMENTS from my friends...i am sharing here my view for a educational purpose and i am still a learner and i am sharing not my only my view and my experience if u PURELY LISTENNED to my MARKET COMMENTARY... i am not a market mover...just i am keep changing my view according to the PRICE ACTION and i written detailly about that in market commentary...there is no short cut to earn money and cant make a fast cash...if u do that also it may go like that....
My ambition is to create an awareness to the traders, to promote the education not to do BLINDLY...If u look my past 4 yrs chart and now...i fine tuned or refined my strategy...and still looking for finetune...so if u r following my trade plans as a signal its not my fault...If you are not encouraging also not mind but dont discourage...if you are not comment also dont leave the negative comments, if you are not motivate also dont demotivate...because NAGATIVE is more powerful than POSITIVE...i wont care about such comments...because of your comments i wont stop anything in MY PRACTICE...it will take time and to digest such comments for first 2-3 days and again i rebuilt my positive activity and my view and then again i keep start my sharing...i dont need a roadblocks in my journey. If it happen also i need to cross that and i continue...but that crossing time is DELAY for my journey to reach my GOAL...so try to be a friend...just learn or leave .if you didnt like a page in your story book just turn that... Don't look that, Like that dont look my chart...just skip that...thanks lot ...here some quotes by BRUCE LEE...
1. I fear not the man who has practiced 10,000 kicks once, but i fear the man who has practiced one kick 10,000 times "
2. A GOAL is not always meant to be reached, it often serves simply as something to AIM at
3. Those who are UNAWARE they are walking in darkness will never seek the light
4. To hell with circumstances i create the opportunities
5. I don't teach you anything. I just help you to know yourself
6. Always be yourself, express yourself, have a faith in yourself, do not go out and look for a successful personality and duplicate it.
7. Don't fear failure... in great attempts it is glorious even to fail
8. Absorb what is useful, reject what is useless, add what is specifically your own
9. Notice that stiffest tree is most easily cracked, while the bamboo or willow survives by bending with the wind
10. The successful warrior is the average man with laser-like FOUCS -
Market Commentary:
LEARNING ELLIOTT WAVES IS LITTLE BIT TOUGH (FOR ME IN BEGINNING) BUT I TOOK IT AS A CHALLENGE AND THAT IS NOT IMPOSSIBLE ALSO...
First have an look for the positional trend i shared here previous....if you are a follower of me...and sometimes i will share the counter trend trade also in 15 mins and 1hr...but that is risky ones...so if the trend is bearish or bullish, if i am expecting the correction...book the profit there and wait the correction to end and again go with the trend....DONT TRADE THE COUNTER TRADE SETUP...you will took loss too...try to identify the short term pull back and the long term pull back after that took small lots in the short term PB with strict stop and go with big lots in the trend side that is long term. I WONT TOOK ALL THE TRADE PLAN SHARED HERE...
Read the market commentary inside the chart what i shared here carefully and try to learn Elliott waves...otherwise its tough to understand the market commentary and my analysis. I wont give a entry, stop loss and take profit in my chart...it is only for EDUCATIONAL PURPOSE and i am sharing how i am analyzing the pair and labeling them according to the Elliott wave theory...I AM JUST SHOWING THE TREND HOW IT MAY GO AND MY VIEW(it may wrong too)..so DON'T FOLLOW BLINDLY MY CHART..take this as a reference and if it correlate to you strategy took the trade as per your strategy...DON'T ASK ABOUT YOUR RUNNING TRADES i wont comment on them and I WONT SUGGEST TO TAKE MY TRADE SETUP.
I am a technical analyst based on trendline, channel, fib retracements, expansion, stochastic for divergence, EMA's and MA's are finding the pull backs and MAJOR IS ELLIOTT WAVES...those mentioned above are using as a TOOLS only. I am not a fundamental, sentimental trader...but only the fundamental will boost my technical analysis to reach my target or sometimes it will go against me and then i will manage the trade according to the Elliott waves alternate views...Each and every trade plan i am sharing here has a alternate view and i am sharing only the most probabilities(70-80%) here...sometimes the other (20-30%) may market do..then i will change the wave counts and labeling according to the price action.
All labeling and wave counts done by me by manually and i will keep change according to the LIVE MARKET PRICE ACTION. So dont bias, hope on my trade plans...try to learn and make your own strategy...Following is not that much easy...I AM NOT RESPONSIBLE FOR ANY LOSSES IF U TOOK THE TRADE ACCORDING TO MY TRADE PLANS....THANKS LOT..CHEERS

COPPER (XCU/USD) – Week 20 – New top expected.As we mentioned in our previous analysis, Copper pulled-back and it looks like the price is starting to lose momentum, after reaching our trendline.
In this context, in the coming week expect this pair to make a new top.
Trade with care.
Best regards,
Financial Flagship
Disclaimer: The analysis provided is purely informative and it should not be used as financial advice. Remember that you need a plan before you start trading; so, take this knowledge and use it as a guidebook that will ultimately help you understand the market and easily predict your next move.
📢Check out our:
📹YouTube: www.youtube.com
🌍Website: www.finflagship.com


COPPER (XCU/USD) – Week 19 – Strong bulls.In our previous analysis, Copper continued, as expected, its strong bullish momentum.
In this context, we anticipate a pullback to occur in the following days, towards the support area before continuing the big Monthly uptrend.
Trade with care.
Best regards,
Financial Flagship
Disclaimer: The analysis provided is purely informative and it should not be used as financial advice. Remember that you need a plan before you start trading; so, take this knowledge and use it as a guidebook that will ultimately help you understand the market and easily predict your next move.


Copper prices are facing bullish pressure, potential upside Copper prices are testing our first support in line with our 23.6% fibonacci retracement, 61.8% fibonacci extension and ascending trend line where we could see a further upside above this level. EMA and Ichimoku cloud are showing signs of bullish pressure as well, in line with our bullish bias. A break above our upside confirmation level in line with our horizontal swing high resistance could provide the bullish acceleration to our first resistance target.

Copper prices are testing support, potential bounce Copper prices are testing our first support in line with our 23.6% fibonacci retracement, 61.8% fibonacci extension and ascending trend line where we could see a further upside above this level. EMA and Ichimoku cloud are showing signs of bullish pressure as well, in line with our bullish bias.


Copper prices are facing bullish pressure Copper prices are facing bullish pressure from our first support in line with our 23.6% fibonacci retracement, 61.8% fibonacci extension and ascending trend line where we could see a further upside above this level. EMA and Ichimoku cloud are showing signs of bullish pressure as well, in line with our bullish bias.

Super cycle still ON / next levels to be watchedCopper colored gal of mine,
I love you 'cause you're so divine,
Say you'll always be my clinging vine,
Copper, copper, copper, copper colored gal of mine!

COPPER (XCU/USD) – Week 18 – Strong bulls.In our previous analysis, Copper broke the top, despite our initial expectations regarding a possible price decrease.
Having said that, in the following days, we anticipate a pullback towards the support area before resuming its uptrend.
Trade with care.
Best regards,
Financial Flagship
Disclaimer: The analysis provided is purely informative and it should not be used as financial advice. Remember that you need a plan before you start trading; so, take this knowledge and use it as a guidebook that will ultimately help you understand the market and easily predict your next move.

Copper is facing bullish pressure, potential upside Copper prices are facing bullish pressure from our first support in line with our 38.2% fibonacci retracement, 61.8% fibonacci extension and graphical pullback support, where we could see a further upside above this level. EMA and Ichimoku cloud are showing signs of bullish pressure as well, in line with our bullish bias.
