CORN Heist: Steal Short Profits Before Bulls React!🚨 CORN HEIST ALERT: Bearish Raid Ahead! 🚨 Swipe the Loot Before Cops Arrive! 🌽🔻
🌟 Attention, Market Bandits & Profit Pirates! 🌟
🔥 Thief Trading Intel Report 🔥
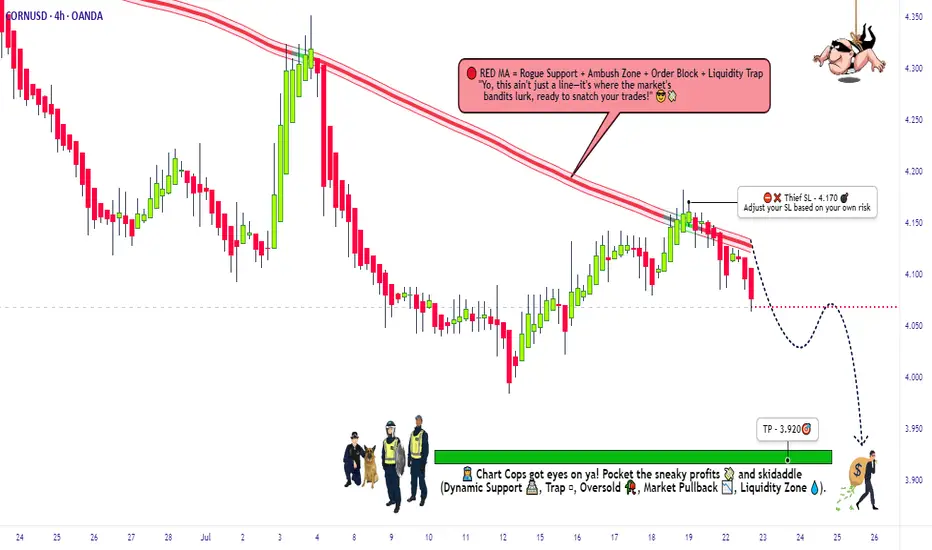
The 🌽 CORN CFD market is setting up for a bearish heist—time to short-swipe the loot before the bulls rally their defenses! Police barricade (resistance) is holding strong, but oversold conditions + consolidation hint at a trend reversal trap. High-risk, high-reward—just how we like it!
🎯 Heist Strategy (Swing/Day Trade)
Entry (Bearish Raid) 🏴☠️
"Vault’s unlocked! Swipe shorts at any price—OR set sell limits *near 15M/30M pullbacks for a cleaner steal!"*
Stop Loss (Escape Route) 🛑
Thief’s SL at nearest 4H swing high (4.170)—adjust based on your risk tolerance & lot size.
Pro Tip: Tighten SL if trading multiple orders!
Target (Profit Escape) 🎯
3.920 (or bail early if cops (bulls) show up!)
🌽 Market Snapshot: Why CORN is Ripe for a Raid
Neutral trend leaning bearish—consolidation breakout likely!
Key Drivers:
Macro pressure (USD strength, crop reports)
COT data hinting at big players positioning short
Seasonal trends favoring downside
Want full intel? 🔍 Check COT reports & intermarket analysis!
🚨 Trading Alerts (Avoid the Cops!)
News = Volatility Trap! 📰🚔
Avoid new trades during high-impact news.
Trailing stops to lock profits on running heists!
💥 Boost This Heist! 💥
"Like & boost this idea to fuel our next raid! More steals = more profits for the gang! 🏴☠️💰
Stay tuned—another heist drops soon! 🚀🤝
CORN trade ideas
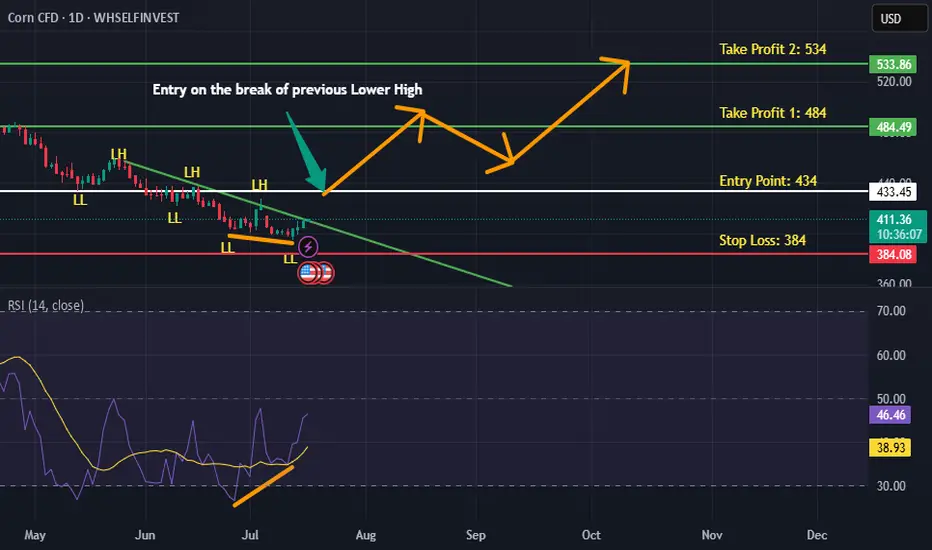
CORN is BullishPrice was in a strong downtrend, however the bullish divergence with trendline break hints the return of bulls. If previous lower high is broken with good volume then we can expect a strong reversal as per Dow theory. Targets are mentioned on the chart.

THE GREAT CORN GRAB! (Bearish CFD Heist)🌽 THE CORN HEIST: Bearish Raid Plan (Swing/Day Trade) 🚨💰
🌟 Attention, Market Robbers & Money Makers! 🌟
(Hola! Oi! Bonjour! Hallo! Marhaba!)
🔥 Based on the ruthless Thief Trading Style (TA + FA), we’re plotting a bearish heist on the CORN Commodities CFD Market! Time to short like a bandit and escape with profits before the bulls catch us! 🏴☠️💸
🎯 MASTER HEIST PLAN (BEARISH RAID)
Entry Point (Sell Limit / Market):
"The vault is open—swipe the bearish loot at any price!"
🔹 *For safer heists, set sell limits near pullbacks (15M/30M).*
Stop Loss (Escape Route):
📌 Thief SL at nearest swing high (1D timeframe) – 4.4000
📌 Adjust SL based on risk, lot size, & multiple orders.
Profit Target (Escape Before Cops Arrive):
🎯 4.1000 (or exit early if the trap snaps shut!)
🌽 MARKET TREND: NEUTRAL (BEARISH OPPORTUNITY!)
Consolidation zone = Thief’s playground!
Oversold? Maybe. But the real trap is where bullish robbers get slaughtered.
High risk = High reward—only for cold-blooded traders!
📡 FUNDAMENTAL INTEL (DON’T SKIP THIS!)
🔗 Get full reports (COT, Macro, Seasonals, Sentiment, Intermarket Analysis) in our bio0!
🚨 TRADING ALERT: NEWS = DANGER ZONE!
❌ Avoid new trades during news!
🔐 Use trailing stops to lock profits & escape alive!
💥 BOOST THIS HEIST! (HELP US ROB THE MARKET!)
🔥 Hit LIKE & FOLLOW to strengthen our robbery squad!
💸 More heists = More profits. Stay tuned for the next raid!
🐱👤 See you in the shadows, bandits! 🤑🚀


Shady CORN Scheme: Bullish Plot or Market Trap?🌟 Ultimate CORN Heist Strategy: Swing Trade Plan 🌟
Greetings, Wealth Chasers & Market Mavericks! 🤑💸
Ready to pull off a legendary heist in the 🌽 CORN Commodities CFD Market? Our Thief Trading Style blends sharp technicals and fundamentals to craft a high-octane plan for massive gains. Follow the strategy below, stick to the chart, and aim to cash out near the high-risk Red Resistance Zone—an electrified level where overbought conditions, consolidation, or trend reversals could spark traps from bearish bandits. Let’s lock in profits and treat ourselves to the spoils! 💪🎉
📈 Entry Plan: Launch the Heist! 🚀
Wait for a breakout above the Moving Average at 4.5800 to ignite your long entry—bullish riches are calling!
Option 1: Set Buy Stop Orders just above the MA for breakout confirmation.
Option 2: Place Buy Limit Orders on a pullback to the most recent swing low/high within a 15- or 30-minute timeframe.
📢 Pro Tip: Set an alert on your chart to catch the breakout in real-time! ⏰
🛑 Stop Loss: Protect Your Loot! 🔒
For Buy Stop Orders, place your Stop Loss after the breakout confirms to avoid premature exits.
Thief SL Recommendation: Set at the recent swing low on the 4H timeframe (4.4300) for day/swing trades.
Adjust SL based on your risk tolerance, lot size, and number of open orders—play it smart! ⚠️
Feeling rebellious? Set your SL wherever you dare, but don’t blame us if the market bites back! 😎🔥
🎯 Target: Grab the Gold! 🏴☠️
Aim for 4.8000—take partial profits or exit fully before hitting this level.
Scalpers: Stick to long-side scalps. Got deep pockets? Jump in now. Otherwise, join swing traders for the full heist.
Use a trailing Stop Loss to lock in gains and keep your money safe. 💰
🌽 CORN Market Outlook: Why This Heist Works 🌟
The CORN CFD market is currently neutral but shows strong bullish potential, driven by:
📰 Fundamentals: Check macroeconomic data, COT reports, geopolitical events, and news sentiment for a full picture.
📊 Intermarket & Seasonal Analysis: Aligns with favorable positioning and future trend targets.
⚠️ Trading Alert: News & Position Management 🚨
Avoid new trades during major news releases to dodge volatility spikes.
Use trailing Stop Loss orders to secure profits and protect open positions.
Stay updated via reliable sources like Investing.com for real-time news impacting CORN prices.
💥 Boost the Heist! 🚀
Support our Thief Trading Style by hitting the Boost Button to amplify our robbery squad’s strength! 💪 Together, we’ll swipe profits effortlessly every day. Stay tuned for the next heist plan—more riches await! 🤑🐱👤
Let’s make this CORN heist legendary! 🌽💸🎉

Corn Market Trends: Production in Argentina and Brazil (02.11)As the global corn market navigates supply constraints, the latest WASDE report highlights a downward revision in production forecasts for Argentina and Brazil, key players in global exports. Adverse weather conditions, including prolonged heat and dryness in Argentina and planting delays in Brazil, have led to lower yield expectations, tightening global supply chains.
Production Declines in Argentina and Brazil
Argentina's corn production is now projected at 50 million metric tons, down from 51 million, reflecting yield losses due to drought conditions in key growing regions. Brazil's output is also revised downward to 126 million metric tons, mainly due to slow second-crop planting progress in the Center-West region, which is critical for global supply.
Impact on Global Corn Trade
With reduced output from South America, global corn trade is seeing shifts. The WASDE report lowers projected corn exports from Brazil and Argentina, increasing reliance on alternative suppliers like the United States. However, U.S. exports are expected to face stiff competition from other global producers, including Ukraine and South Africa, despite ongoing geopolitical tensions.
U.S. Market and Price Dynamics
The U.S. corn market remains stable, with production estimates unchanged at 14.87 billion bushels. However, ending stocks are revised downward to 1.54 billion bushels, reflecting stronger demand. The season-average farm price for U.S. corn is raised to $4.35 per bushel, reflecting tighter global supplies and steady domestic consumption.
Key Market Implications
• Rising Global Prices: Lower South American output could support higher corn prices worldwide, benefiting U.S. exports.
• Shift in Import Demand: China, a major corn buyer, has reduced its import forecast, while Vietnam and Chile have increased theirs, signaling shifting trade patterns.
• Weather Risks Persist: Continued adverse weather could further impact production estimates, making upcoming forecasts critical for market direction.
Evolving weather conditions and policy changes could further impact global supply chains and price trends.
TOCOM:TGCN1! BMFBOVESPA:CORN11
CORN is BullishCorn has not only broken the descending trendline but has also successfully breached previous lower high after the emergence of a bullish RSI divergence on weekly time frame. Entry can be taken at current price as according to Dow theory now price will start making higher highs and higher lows. Targets are mentioned on the chart.

Corn Market: Outlook Driven by Supply Trade, and Demand ShiftsThe global corn market in 2025 is undergoing notable transitions shaped by changing supply dynamics, evolving trade flows, and increasing demand across key sectors. The January 2025 WASDE report sheds light on the significant pressures and opportunities facing this essential commodity as production adjustments and geopolitical shifts come into play.
Corn production forecasts for the 2024/25 season reveal not so simple global picture. The U.S., the world’s largest corn producer, is grappling with significant yield losses due to ongoing drought conditions in the Corn Belt. Current projections estimate U.S. production at 14.5 billion bushels, marking a drop compared to prior seasons. Meanwhile, Brazil has emerged as a major player, capitalizing on favorable weather and expanding its planted acreage to achieve a record-high output of 132 million metric tons, securing its position as a leading exporter. However, production challenges in China, driven by high input costs and limited arable land, are expected to drive the nation’s continued reliance on imports.
Trade dynamics are shifting, with Brazil solidifying its role as a top corn exporter , leveraging competitive pricing and a streamlined export system. U.S. exports, on the other hand, are projected to decline to 49 million metric tons, reflecting challenges posed by strong competition and elevated domestic prices. China remains the leading importer, with anticipated purchases of over 24 million metric tons, largely driven by demand from its recovering swine sector and efforts to replenish depleted grain reserves. Elsewhere, nations in North Africa and the Middle East are maintaining strong import levels to address food security needs, particularly for animal feed applications.
Demand for corn remains robust but multifaceted in its drivers. Livestock feed continues to dominate global consumption, particularly in regions where meat production is rapidly expanding. Ethanol remains a cornerstone of U.S. domestic demand, as renewable energy mandates ensure a steady draw on supplies. Industrial uses of corn are also diversifying, with bio-based plastics and other applications gaining traction, adding a layer of complexity to the market’s demand profile.
Corn prices are expected to remain elevated through 2025, reflecting tight global supplies, ongoing trade uncertainties, and persistent weather challenges. The WASDE report projects U.S. corn prices to average $6.70 per bushel, up from the previous year’s average. Key drivers include adverse weather conditions in critical growing regions, particularly the prolonged droughts affecting the U.S., and the potential for La Niña disruptions in South America. A weaker U.S. dollar may offer some relief to American exporters, enhancing price competitiveness, though Brazil's strong presence in global trade poses a challenge.
For investors, the 2025 corn market presents a range of opportunities and risks. Elevated price volatility makes corn futures attractive for hedging and speculative strategies. Additionally, investments in agricultural innovation, such as drought-resistant seed technology and precision farming, offer long-term potential. Those seeking diversified exposure may consider agriculture-focused ETFs or equities tied to the corn supply chain, including logistics, equipment manufacturers, and fertilizer producers. As always we should stay sharp, the corn market in 2025 is shaped by a convergence of production pressures, evolving trade patterns, and robust global demand.
BMFBOVESPA:CCM1!
CBOT:ZC1!


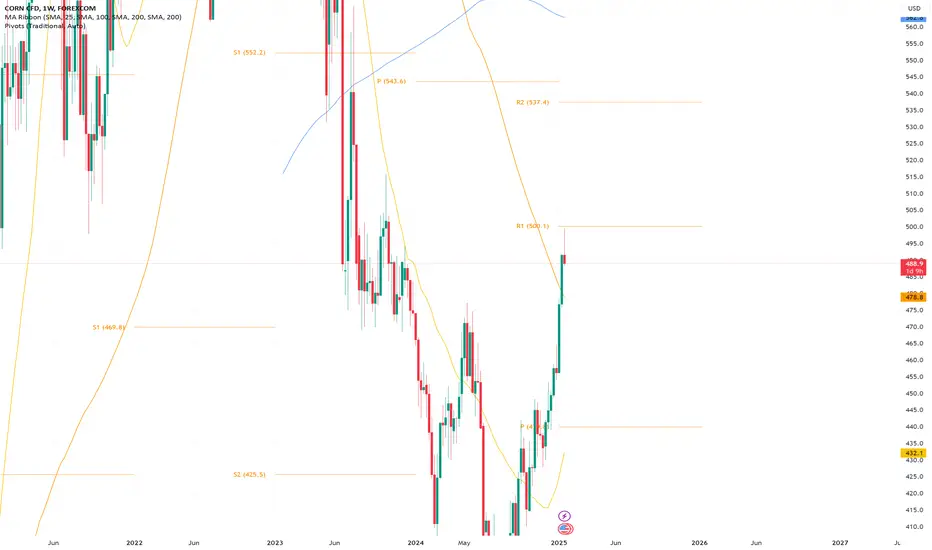
Corn: Clear way downCorn market has had a somewhat of a shock revival over the past couple of weeks. The latest WASDE report provided a final jolt to the massive speculative positioning which we deem to be at an extreme around the 500 USD level.
We think the latest move has been an overkill and some of the positioning is bound to unwind as the speculators might have gotten ahead of themselves. Large stale short positions were the predominant drive of the move for the most part.
Therefore, all the latest long positions are at risk of being trapped.
Strategic short with stop around at the 555-560 USD level.
Targeting pre-WASDE levels.
crypto is crypto, but do you need to buy corn? - If the trend line breaks, this is the beginning of a bullish trend.
- a Formulated is Golden Cross Moving Average
- the reason for the rise in corn prices is the decrease in the EU corn harvest in 2024/25. This is the third consecutive year of poor harvest.
If you have anything to add, please write in the comments.

H4 CORN Short
Daily Chart MACD crossing down
Tomorrow big news
Day trade today, short Corn
Long term, I still want to LONG it..
Because I like to eat corn, especially sweet corn

CORN SHORTCOT datas: OK
Overvalued Short and Long term.
Seasonality is good until mid-February.
Use proper risk managment, dont be so greedy.
Good luck, I hope we will make money from it.
SupplyDemandTechnology.

CORN CFD ANALYSIS IN DAILY TIME Corn Formulated MA Golden Cross And Also Breakout of Falling Wedge Pattern Show Bullish Reversal.
The reason for the rise in corn prices is the decrease in the EU corn harvest in 2024/25. This is the third consecutive year of poor harvest.
This is not a financial advice do you own research from execution of trade.
Taurian

CORN awaiting backtest Not financial advice.
I believe CORN will back test the breakout of the purple descending pattern.
Entry est. FEB 2025

CORN BEARISH TRENDCORN SHOWS bearish momentum forming lower high and lower low
possible to continue the bearish trend
entry price is 429
stop loss is 483
tp1 is 374
tp2 is 320

CORN Loking Bullish End of weeek anaysis1. Current Bullish Sentiment
If you're expecting a bullish move in corn prices, it could be due to several factors:
Supply/Demand Dynamics: Weather conditions, crop yields, or geopolitical events can affect supply, leading to higher prices if there's a shortfall.
Seasonality: Corn often follows seasonal patterns, with prices typically peaking during periods of strong demand or when harvests are threatened.
Technical Momentum: The price might be building upward momentum, with increasing volumes indicating strong buyer interest.
2. Stop-Loss at 671
A stop-loss at 671 suggests that you want to limit downside risk by exiting the trade if the price drops below this level. Here's what this indicates:
Support Level: 671 might represent a recent support zone where prices previously held during a downward move.
Risk Management: It’s close enough to protect you from major losses if the market turns against you, but still gives enough room for natural price fluctuations without triggering the stop too early.
3. Take-Profit at 1600
Setting a take-profit at 1600 suggests you're expecting a substantial upside, and here's what it implies:
Major Resistance or Long-Term Target: This could be a long-term resistance level from historical price action or your analysis suggests a big move based on fundamentals or technicals.
High Reward-to-Risk Ratio: With a stop at 671 and take-profit at 1600, you're looking for a high reward-to-risk ratio. The distance between the two levels shows a significant potential upside if the bullish trend plays out.

Corn futures long ideaCORN CFDs presenting a large 4 year long harmonic structure with a trendline break locally. I think this is a deep value area and will be watching this chart for more accumulation structures. I think its safe to take a 3:1 RR position here with the goal of adding to this position as more chart data presents itself.

[CORN] Inverted H&S completionCAPITALCOM:CORN completing an inverted H&S, possibly trying to climb to its EMA 220, around 440 - 450.

CORN, bound for huge bounce.. Drought will make prices surge!CORN has overextended correction to 5.74 from a high of 6.8. The overreaction is a bit on the unreasonable side with worst DROUGHT in years endangering world's supply.
Price is back at 1.0 FIB level. This is beyond bargain / discount. Best to seed at this range.
Based on monthly data, the 'trend shift' based on metrics hasn't changed. Reversal is on queue at the current price range. If anything, the market is too generous to offer at very low prices before the potential future valuation.
4H histogram is currently shifting -- with buyers attempting to reverse the trend.
Spotted at 5.7
TAYOR
Safeguard capital always.
-------------
some related news:
Central US is now getting worst of the drought. Corn crops are stressed, rivers are running low
The middle of the country is extraordinarily dry
ByJIM SALTER Associated Press
June 30, 2023, 12:06 AM
Drought Midwest
This photo provided by Mike Shane shows Shane as he stands in his corn field near Peoria, Ill., Tuesday, June 27, 2023. By now, the corn stalks should be 10 feet high. Instead, they’re barely up to Shane’s waist. Illinois and other corn-growing states in the cent...Show more
The Associated Press
ST. LOUIS -- Mike Shane’s Illinois farm got a nice soaking on May 8, shortly after he planted his corn crop. Since then, rain has been hard to come by.
Plenty of storms have ventured close only to fizzle out before making it to Shane’s 200-acre spread near Peoria.
“It comes across the Mississippi River and then just disappears,” Shane, 47, said. “My corn looks absolutely terrible right now.” Without substantial rain soon, “I just don’t see any hope for it,” he said.
Heavy rain over the winter eased the drought in the West, but now the middle of the country is extraordinarily dry. Crops are stressed, rivers are running low, and cities and towns are anxiously hoping for a break in the weather.
Experts say the drought in the central U.S. is the worst since at least 2012, and in some areas, is drawing comparisons to the 1988 drought that devastated corn, wheat and soybean crops. This year, although temperatures have been generally mild through the spring and early days of summer, rainfall has been sorely lacking.
The U.S. Drought Monitor, operated by the federal government and the National Drought Mitigation Center at the University of Nebraska-Lincoln, reports that nearly half of Kansas is in either extreme or exceptional drought condition — the highest drought designation. More than a quarter of Nebraska is in extreme drought, and 13% is in exceptional drought. Arid conditions permeate Minnesota, Iowa, Wisconsin, Michigan, Indiana, Missouri and Kentucky.
The frequency and intensity of droughts and rainfall are increasing due to burning fossil fuels and other human activity that releases greenhouse gases, according to data from a pair of satellites used to measure changes in Earth’s water storage. The study was published in March in the journal Nature Water.
Adam Hartman, a meteorologist at the National Oceanic and Atmospheric Administration’s Climate Prediction Center, said some parts of the central U.S. have been experiencing extreme drought since the winter. In other states, “flash droughts” have popped up over the past 2-3 months.
“As a result you’ve see drastic losses in topsoil, subsoil moisture,” Hartman said. “We’ve seen ground water levels start to lower as well. We’ve seen stream flows start to decline.”
Crops are feeling the impact. The U.S. Department of Agriculture now rates only half of the U.S. corn crop as good or excellent — the lowest percentage since 1988. Nearly two-thirds of the nation’s corn-growing areas are in drought.
“That gives us some indicator that we’re seeing widespread stress on those crops throughout the Corn Belt,” said Krista Swanson, an economist for the National Corn Growers Association.
If rains don't arrive soon, Swanson believes total yield could be down about 1 billion bushels from the original projection of 16.7 billion bushels.
That won’t necessarily mean higher costs for consumers because much of the corn is used for feed, ethanol or is exported, Swanson said. The real impact is on the farmers.
“Their cost-per-acre is the same regardless of what they produce,” Swanson said. “In these years where we have lower production, on the farmer side that’s a challenge.”
Water levels are dipping in rivers. The Mississippi River — especially from southern Illinois to the south — is extremely low in many spots. It was just last fall that the river reached or neared record low-water marks in several places, only to bounce back to flood levels in the spring, before the latest drought-fueled decline.
Lynn Muench, a senior vice president for the American Waterways Operators, which advocates for the tugboat, towboat and barge industry, said barge capacity is being voluntarily reduced on parts of the Mississippi River.
Losing capacity is a financial setback but operators are taking it in stride, Muench said.
“We’re a flexible and resilient industry so we’ll keep going,” he said.
Colin Wellenkamp, executive director of the Mississippi River Cities and Towns Initiative, said many communities are on edge. The drought last fall cost river communities billions of dollars in losses due to increased energy and water purification costs, lost tourism revenue, commodity losses and other hits.
“Now we’re right back into drought again,” Wellenkamp said. So far, impact has been minimal, “but if we don’t get relief in July, that’s all going to change,” he said.
On Shane's 200-acre farm, corn should be standing 10 feet tall by now. It's barely to his waist. The leaves are yellowed and Shane isn't certain the ears of corn are even developing.
“If that's the case, it's worthless,” he said.
But farmers aren't giving up hope. Swanson said the El Nino weather pattern that has taken hold typically means more rain and better growing conditions in the central U.S.
“We could see more favorable weather over the next two months, which could have a positive impact,” she said.
But even with El Nino, Hartman noted that the seasonal outlook for the summer months projects below-normal rainfall.
“This drought could stick around for a little bit,” Hartman said.

CORN Can Go for Cup Target.When the CORN 4-hour chart is examined; It is observed that the price movements continue within the Cup formation formation. As long as the CORN price does not break below the level of 395.6, it is evaluated that in price movements above the level of 406.8, it can cross the level of 428.8 and target the level of 449.1.

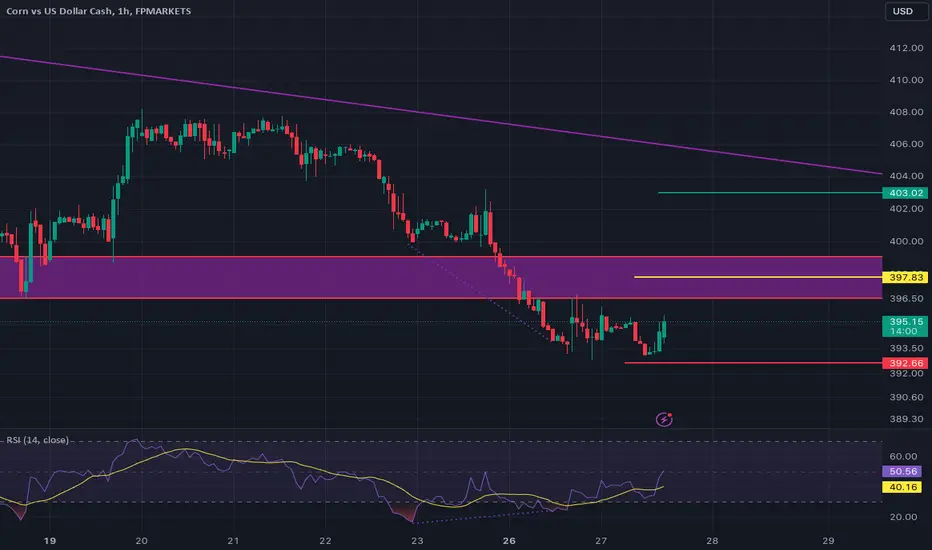
CORN CFD - Starting of Bullish Trend after Bullish DivergenceCorn analysis is done on an hourly chart. There is a bullish divergence on an hourly chart with a formation of double bottom reversal pattern. Placed an entry on the previous LH with SL placed just below the double bottom.
The Signal is:
EP: 397.83
SL: 392.66
TP: 403.00