CORNUSD trade ideas

CORN BUYHi there. Price is forming a continuation pattern to the upside. Wait for the price to hit the bottom of the pattern and watch strong price action for buy.
Don’t take a trade if you don’t see clearly when big guys are in.


CORNUSD D1buy limit;
tp1=3.448;
RR=1;
tp2=3.490;
RR=2;
tp3=3.528;
RR=3;
sell limit;
tp1=3.577;;
RR=1;
tp2=3.544;
RR=2;
tp3=3.511;
RR=3;
notice:
1:Risk free after tp1;
2:all lines and orders have a few tolerance!!;


Long Corn CFD soonThis area show large order flow imbalance and is low on the larger frame curve. 1:5 RR possible.


CORN - New Upward moveCorn - Strong Buy
Pullbak to demand zone + structure 0.886
Testing ascending trendline
Inside Bar breakout
Entry: 3.550
Take Profit: 3.730/ 4.000
Stop loss: 3.440

Corn trading plan with two scenariosYou can check trade full fundamental and technical analyses in YouTube.
Buy territory for cornChart showing strong support, indicators are positive. First target 3.96. A drop below the recent double bottom looks very bearish. Stop at 3.84.

CORNUSD testing double top, might will rejected into handlei like this set up, just watch closely if double top break, after not much resistance


NEUTRAL CORN standby for Breakout @4.00CORN has been rallying since January and we have an entry position just above $160 per Ton


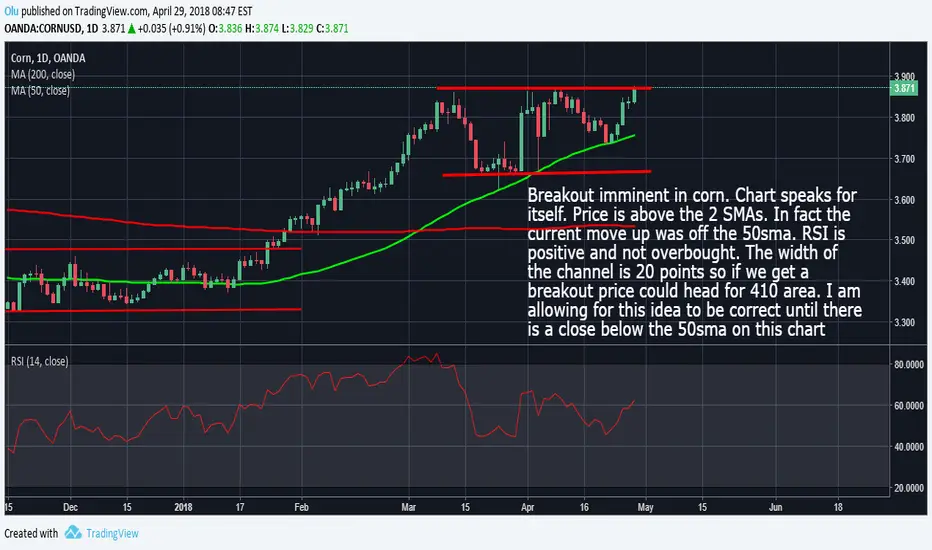
Corn: Breakout Might Be ImminentComments on the chart. To avoid participating in the 'price at resistance' shenanigans' traders might want to wait for a close above and retest of the breakout area. It is the safest option
Corn breakout of a huge falling wedgeCorn (CORNUSD) has broken out of a bullish falling wedge that confirmed by huge trading volume. Price advance may extend to short-term target at 4.8-5.0 or even 5.5, stop loss at 3.6

Lower sowings bullish for corn pricesCorn prices rose sharply on Thursday after the US Department of Agriculture's weekly sowings and stocks reports. The sowings report indicated US farmers plan to reduce corn sowings by 2.14m acres to 88.03m acres, below an expected 89.42m acres. Farmers cited intentions to switch to cotton and wheat, which command relatively higher prices, as the primary reason. Lower corn supply expected from smaller sowing area is bullish for corn prices. A bearish risk for corn is possible further weakening of demand for the crop as USDA stocks data implied corn consumption in the previous three months at 3.68bn bushels, compared with 3.76bn bushels during the same period last year.
On the daily timeframe CORNUSD had been retracing after hitting eight-month high in mid-March.
The Donchian channel is tilted up indicating uptrend.
The MACD indicator is above the signal line and the gap is widening, which is bullish.
I believe the bullish momentum will continue after the price closes above the upper boundary of Donchian channel at 3.828. This level can be used as an entry point for placing a pending order to buy. The stop loss can be placed below last fractal low at 3.623. After placing the order, the stop loss is to be moved every day to the next fractal low, following Parabolic signals. Thus, we are changing the probable profit/loss ratio to the breakeven point. If the price meets the stop loss level (3.623) without reaching the order (3.828), I recommend cancelling the order: the market has undergone internal changes which were not taken into account.
Technical Analysis Summary
Position Buy
Buy stop Above 3.828
Stop loss Below 3.623
To receive FREE analytical materials on your email open Demo account</a at IFC Markets.

CORN GOING LONG?I'm anticipating corn prices to ascend to highs of $5 in the next couple of weeks guys.
Break of this trend line should give the green light for all the bulls!
I am however expecting a kiss on the trend line accompanied by a sharp reversal to the upside target of $5.
I'll give updates on this idea!
TP: $5 [ /i]

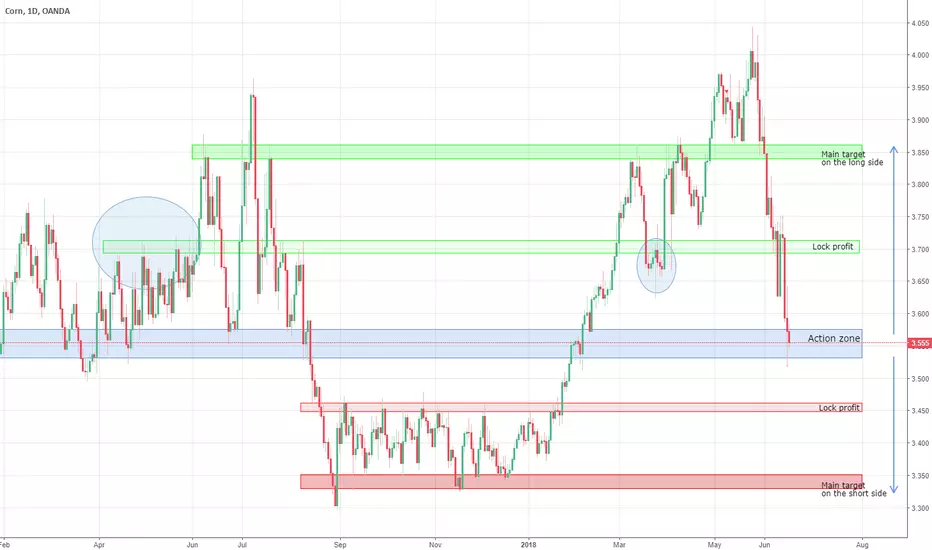
Corn: Buy DipsThe current declines are a regular counter trend dip, triggered after hitting the weekly resistance area around 3.85. This decline could continue for a couple of days after which base building should occur around the key support at 3.649. here the weekly cloud support and daily retracements and regressions fall together. Note that base building can easily take up to 3 weeks to fully pan out.
Expect a bit more weakness followed by a period of choppiness. The longer term remains bullish targeting 3.85 and 4.07 after that.
Primary trend: positive
Outlook: regular counter trend dip, positive
Strategy: hold-long and/or buy dips
Support: 3.649 / 3.592
Resistance: 3.85 / 4.07+
Outlook cancelled/neutralized below 3.592
OANDA:CORNUSD
