super buy status on cci - retrace immediateon weekly, we have a super buy trend peak.
this week and next will see a retrace.
fr
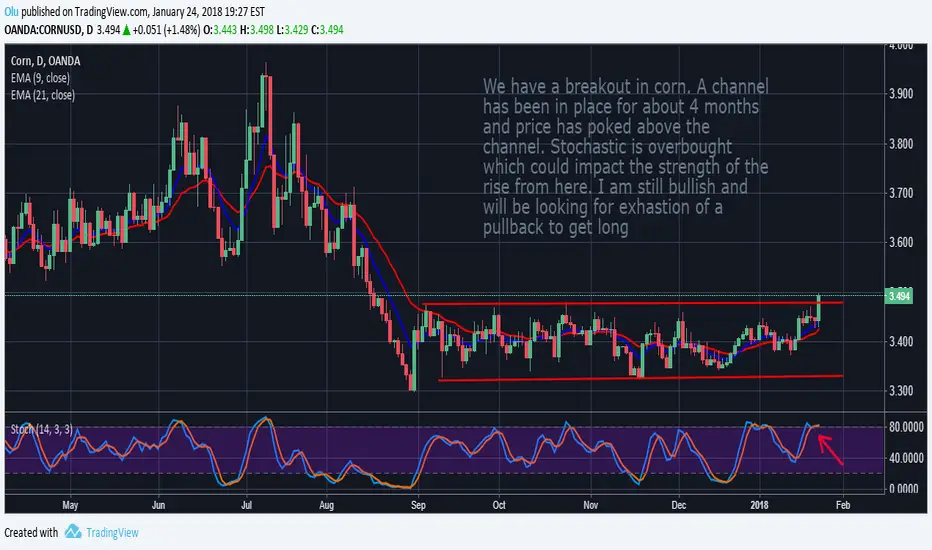
CORNUSD trade ideas

CORN - Strong trend continues...Hi TViewers,
CORN is continuing it's solid trend from it's break above the 3.40(ish) mark and is looking very strong.
As you can see on the chart it has pushed through it's previous minor resistance points at about 3.70 with excellent volume which would lead us to believe it will continue.
We could look to buy here if you weren't already long. Those looking for more assurance could look at the possible crossing of the 50/200 day SMA as entry point. This "Golden Cross" will be a big bullish signal and if it get's solid volume it will be another excellent sign for CORN.
This is not financial advise.
Please don't invest more than you can afford to lose.
Let me know your thoughts in the comments below.


Long Term Corn Buying Opportunity Corn is currently retesting a strong S/R level dating back to 2004. If it holds this will be an excellent long term high R/R long trade setup.


Corn , possible huge breakup in 3/8 daysCCI long deep sold is changing.
get ready , dont use capital you cant afford to lose.
good luck
fr


CORNUSDDown Trend.
Price close to the upper band of regression line.
Bearish engulfing.
Bearish divergence.


CORNDown Trend.
Price outside the upper band of regression line.
Bearish engulfing.
Overbought Indicator.

Corn 240 longJeddingen Divergence seems to successfully predict reversals on the Corn (4H timeframe). The past 4 signals where very accurate, this accuracy might continue.
There is a current bullish jeddingen divergence (divergence of price vs. momentum) and a little pullback, so it would be a good time to enter the trade.
Take profit on price crossing-up of the trendline or wait until price comes near to the resistance line.

Waiting for short setupIf price stays in this corrective channel i want to sell the highs, short terms buys still possible but i prefer the sell trades on this one. Price action always tells us what to do

Example of a head and shoulders topThe shoulders are about the same height and the head is higher than both shoulders

Corn setting a base for up trendThe monthly cornusd chart looks like it is setting up a base for a new uptrend to begin.
October '15 new resistance->support line at 3.502. Price has closed and held above this line for past 4 months.
+DI up and ADX is rising though still below 0
TRIX divergin with price since 2014 with 3 points of focus
Stoch coming off oversold and moving up
Weekly
3.644 last key resistance->support with price currently sitting on it.
Though below 20, +DI and ADX beginning to trend up. The TRIX near 0 but remains positive
Daily
In all 3 time frames, ADX and DMI are not that strong but positive. TRIX put in a sup->res line at 3.648. Price is currently spinning on this point and will be key to hold if price is to move higher from here.


Corn symmetrical triangle upside breakCorn has broken through the upside of a symmetrical triangle, driven by disastrous weather reports across the US. Prices are anticipated to hit 3.752, thereby completing a bearish gartley pattern. It is expected that prices will then travel down to 2.653 which is a 38.2% retracement of AD of the gartley pattern, retest the triangle before moving further higher

Breakout-CORNCORN price has broken bullish trend. Pullback has finished and breakout is confirmed. We can expecet some bearish movement till 3,5 level. If its broken, bearish movent can be projected till second support structure 3,3 aprox.
