CORNUSD trade ideas

spread wheat corn 10:56 15-Aug-19.LOG
10:56 15-Aug-19
spread wheat corn
There is no audio in my videos.
This is a demo ac.
I have a real ac with oanda.
I spread trade WHEAT versus CORN.
I follow more or less -
Keith Schap – The Complete Guide to Spread Trading
The guy who spreads and makes a little every day is the one who walks away with
the big money.
–A veteran trader, quoted in Futures
Every time i enter a trade in WHEAT i enter a trade in CORN with the same amount of units.
The trades can last hours, days or weeks.
Patience and discipline and money management. I will not lose more than 5% of the equity.
I can trade every hour or other.

spread wheat corn 09:54 15-Aug-19.LOG
09:54 15-Aug-19
spread wheat corn
There is no audio in my videos.
This is a demo ac.
I have a real ac with oanda.
There is no sound recording.
I spread trade WHEAT versus CORN.
I follow more or less -
Keith Schap – The Complete Guide to Spread Trading
The guy who spreads and makes a little every day is the one who walks away with
the big money.
–A veteran trader, quoted in Futures
Every time i enter a trade in WHEAT i enter a trade in CORN with the same amount of units.
The trades can last hours, days or weeks.
Patience and discipline and money management. I will not lose more than 5% of the equity.
I can trade every hour or other.

spread wheat corn 08:29 15-Aug-19.LOG
There is no audio in my videos.
This is a demo ac.
I have a real ac with oanda.
There is no sound recording.
I spread trade WHEAT versus CORN.
I follow more or less -
Keith Schap – The Complete Guide to Spread Trading
The guy who spreads and makes a little every day is the one who walks away with
the big money.
–A veteran trader, quoted in Futures
Every time i enter a trade in WHEAT i enter a trade in CORN with the same amount of units.
The trades can last hours, days or weeks.
Patience and discipline and money management. I will not lose more than 5% of the equity.
I can trade every hour or other.

spread wheat corn 13:51 14-Aug-19.LOG
spread wheat corn
13:51 14-Aug-19
This is a demo ac.
I have a real ac with oanda.
There is no sound recording.
I spread trade WHEAT versus CORN.
I follow more or less -
Keith Schap – The Complete Guide to Spread Trading
The guy who spreads and makes a little every day is the one who walks away with the big money.
–A veteran trader, quoted in Futures
Every time i enter a trade in WHEAT i enter a trade in CORN with the same amount of units.
The trades can last hours or weeks.
Patience and discipline and money management. I will not lose more than 5% of the equity.
I can trade every hour or other.
OANDA:CORNUSD vs OANDA:WHEATUSD

spread wheat corn 12:29 14-Aug-19.LOG
12:29 14-Aug-19
This is a demo ac.
I have a real ac with oanda.
There is no sound recording.
I spread trade WHEAT versus CORN.
I follow more or less -
Keith Schap – The Complete Guide to Spread Trading
The guy who spreads and makes a little every day is the one who walks away with the big money.
–A veteran trader, quoted in Futures
Everytime i enter a trade in WHEAT i enter a trade in CORN with the same amount of units.
The trades canlast hours or weeks.
Patience and discipline and money management. I will not lose more than 5% of the equity.
I can trade every hour or other.

spread wheat corn 14 aug 2019 10h58The guy who spreads and makes a little every day is the one who walks away with the big money.
–A veteran trader, quoted in Futures

spread wheat corn 14 aug 2019 9h54The guy who spreads and makes a little every day is the one who walks away with the big money.
–A veteran trader, quoted in Futures

Spread Trading corn versus wheathello
I use spread trading. This is a demo. I have a real ac with oanda . I base my strategy with -
The Complete Guide to Spread Trading (McGraw-Hill Trader's Edge Series)
-Spread trading, a low-risk, high-profit technique, involves buying a contract in one market while selling a different contract in another market to profit from the imbalance between those markets. The Complete Guide to Spread Trading covers the step-by-step mechanics for successfully executing more than 25 calendar, intermarket, interest rate, volatility, and stock index spreads. It explains both basic and advanced spread techniques and strategies, revealing market situations where spreads are most appropriate as well as clarifying what it means to buy or sell a spread, and more.


Corn Retest Chance TomorrowBased on seasonality and current price, the downside direction is more probable. Depending on how strong will be tomorrow's move, I will decide one of the two ways to trade it.
a] Direct bounce off resistance 4.065 with stop-loss nearing 4.165, which is resistance plus average true range. For this, I want to see overlapping candles decreasing in size (volume considered) as we approach the resistance.
b] The second option is to wait until the resistance is broken and stand by until we return to it. I will use this if the further breach is imminent.
Either way, I don't think corn can rally now when the trade war is getting hotter and seasonality says "No!" I will be looking to sell when the price gets to the extended Keltner Channels areas. Could be around 3.7

Head and Shoulders on CornCorn has been forming a head and shoulders pattern since the start of June. We got close to breaking the pattern in the right shoulder ($4.59 was the price to beat and we got to $4.53). While we aren't in the total collapse phase of the market yet - we could start that at any time now.

"Corn: going down as expected" by ThinkingAntsOkDaily Chart Explanation:
- Price bounced on the Major Resistance Zone and started the down move.
- It reached our first target for the bear move at the Middle Support Zone (4.00).
- Now, it has potential to move down towards our second target at the Support Zone (3.395).
- We are looking for sell setups on lower timeframes.
Check our our Weekly Vision. Updates coming soon!
Weekly Vision:


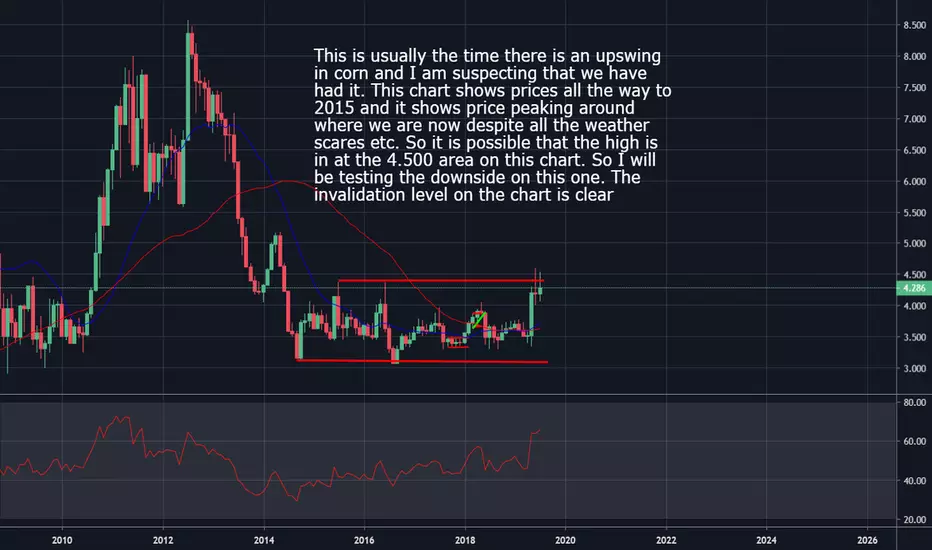
Corn - short on the cob.....Corn has been over a long period within defined range. It appears a double top may have been made over recent months.
Price is now approaching an important support level.
If price breaks this level, we are looking to enter a short on a retest of the level as resistance.
Entry - 4.05
Stop - above the moving average cross
Target - bottom of channel 3.35
RR = 4

Corn - Looking Stronger BuyI have been hovering over the buy button on corn past week. Wasn't convinced enough to enter, and now heading back to Fib retracement towards $4. The closer to this the stronger chance of a rally - from either fundamentals coning out due to crop damage and lower yields, and also some technical short closing since last rally. Keeping in mind the August report, there could be some positioning before here too from fund managers, adding to volatility. That said, if crops are seen as doing well, with ample inventories, and no substantial buying even though China tariff waiver, prices could continue the current short term bearish trend and breeze through $4 down to $3.80. RSI already showing oversold on shorterm though with possible technicals support current prices and allow for some upside. Overall still see risk to upside despite last week's drop.

Corn - Leaning Towards Nice Long TradeI feel corn is an easy trade at moment. If we look at 4.29 as a kind of average way point at the moment.
If it shoots above that with more news of more crop issues in US, look for an overbought RSI to short or jump on the long train if feel confident. There are uncertainties of the amount of acreage planted, and extended heat causing further crop damage, but there is a good harvest in South American (from my understanding)
But if cooling this week ahead, and crop acreage isn't as bad as people thinking, could be a price breakdown below $4.
Basically, prices below that way point of 4.29 I wouldn't short, and above that I wouldn't long. I want to see some fundamental reason for long or short. Though if wanted to place a position at start of week, I would open a long with low risk equity position.
I feel that risk is to upside at moment, with some bullish news easily pushing to $5. Though over this, demand side reduction could occur, so if it gets there, a short position should be considered.
Unless some overly bearish news, I don't see any huge price drops, and see support around that current $4 - $4.29 level, I see this as an easy long trade (unless fundamental breakdown)

"Short Setup on Corn (ZC1!)" by ThinkingAntsOk4 Hour Chart Explanation:
- Price bounced on the Resistance Zone (check it on the Weekly or Daily Vision).
- Price broke the Ascending Trendline.
- Price is, currently, on a Bearish Corrective Structure (ABC Elliot Count).
- If it breaks it at 4,215, the Short Move will be started.
- Our targets for that down move are the two Middle Support Zone and, finally, the Weekly Support Zone.
Check our Weekly and Daily Analysis. They can be really helpful for you!
Weekly Analysis:
Daily Analysis:

Corn: Monthly ViewThis just showing the monthly timeframe to support the weekly short idea already published. We are at an important junction
"Top and Bottom Analysis on Commodities: Corn" by ThinkingAntsOk4 Hour Chart Explanation:
- Price bounced on the Macro Resistance Zone and broke the Ascending Trendline.
- It is currently retesting the Resistance Zone (Pullback).
- If price starts its down path, we have two potential targets points: the Middle Support Zone at 3,782 and the Major Support Zone at 3,424.
Also, our Weekly and Daily Analysis are short views on the Corn.
Weekly Analysis:
Daily Analysis:

$CORN/USD might face serious uptrend. This is not technical analysis but its more likely related with the CoT report which shows potential short on commercials and long on speculators. The reason I believe we will have uptrend:
1. CoT commercials are short as they used to be back in August 2010.
2. There are significant floods in US which devastated the crops.
3. It already broke the descending triangle.
What could go wrong:
1. We had same position on CoT traders in May 2018 which led to drop in the price.
2. US could import corn.
However, I am still bullish on this one and the potential trade will be:
Entry point 4.62, TP: 5.30 - Hedge or SL:3.95-3.85
CoT data in the comments:

Corn Short OpportunityBias: Downwards
- Monthly pinbar
- Look for price to test the 200 day moving average (red)
