Buy COTI/BTC Target 50-150%COTI tested the major support zone and bounced from there. COTI is respecting the uptrend line and moving nicely.
COTIBTC trade ideas

COTI Cup and Handle breakout price break the cup and handle ready to move higher
Buy below 255 sats
stop : 200
Target : 280 , 320 , 385 , 450

COTI ascending trianglePlease feel free to share your view on this pair down below in the comment section. I'm more than happy to be challenged and have an interaction on this idea.
Also make sure to leave a like as it helps me out a lot!
------------------------------------------------------------------------------------------
- Ascending triangle
- Bounced off the ATL @ 185 sats
- Volume declining (w two exceptions)
Big resistance zones: 290 & 330 sats


COTIBTC - Long - Potential 219% - BlockFriday - LONG TERM HODLCOTIBTC - Long - Potential 219.34%
***BlockFriday LONG TERM HODL***
Entry- 264
TP1- 284
TP2- 360
TP3- 548
TP4- 841
SL- 177
- Expect a long hold - Entry can drop lower
- RR - 6.68
- Trailing Buy - 5%
- Trailing Profit - 10%
- Trailing Stop-Loss - No

COTI vs BTC soon bullLot's on nice charts lately, this is one of them and it's looking good.
Just neds to break resistance at fib88 and a bit above, coming when BTC retraces.

COTI 230% To ATH Is Not All... There Will Be More!This is the weekly chart for COTIBTC...
Here we can see a higher low on November 5th compared to the low that was hit back in the week of May 11-18.
After three weeks of flat, green square, we can see prices starting to increase.
The MACD is starting to curve and the RSI is above 45... Pointing to higher prices.
We can also see a very strong/steep crash happen after the August peak... The stronger the drop, the bigger the jump.
So, the next time that COTIBTC starts to move up, it will go beyond the 230% that I mapped on this chart.
I hope you enjoyed the analysis.
Thanks a lot for your support.
Namaste.

COTI Has Lots of News on December 2020 I have previously posted a trend reversal chart for COTI but it was one of the times Bitcoin made a huge move upwards and the trading setup completely changed. This usually happens in crypto just because all altcoins with medium to small market caps are very much dependent to what Bitcoin does.
COTI, has lots of news for DECEMBER 2020 and it is joining the party already. Set your alerts to the zone already indicated on the map and let the price action ride and decided what to do.


COTIBTC is bullish . BINANCE:COTIBTC is flashing bullish sign . There is three sign we should thinking about getting into this trade.
1. Bullish wedge formation
2. Bounced off support
3. RSI is in dip


ALTCOIN That Is About To Go Into A BULLMARKET MartyBoots here. I have been trading for 13-14 years and I am here to share my ideas with you to help the Crypto space.
Bitcoin Bull Market is here right now
AUDIO Is Very Bullish right now and will should move a lot higher
If you want help trading Bitcoin or any other ALT coins hit me up , We will improve your trading


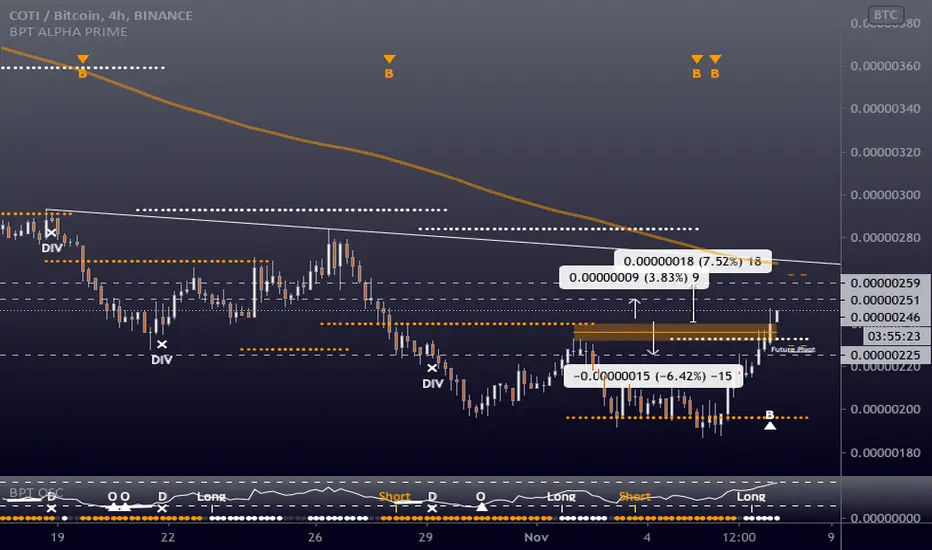
COTIBTC - Long - Potential 7.52%COTIBTC - Long - Potential 7.52%
Entry- 242
TP1- 251
TP2- 259
SL- 225
Triggers;
- Double Test of longer term Resistance
- Active Breakout
Notes;
- Alts Bullish, excellent trading conditions
- Trailing buy, TP & SL recommended
COTI/BTC 1D, BinanceCoti just broke out of the downward channel and it currently acting at the support. It looks like a good entry now given that the BTC dominance is decreasing and once the price is bottomed out that's when alts will have the real fun. The coin looks good technically and also fundamentally with a lot of events lined up in December. In the weekly chart you can also look at the diminishing volume week after week which indicates that the sellers are practically exhausted so looks like a fun ride from here.

coti / btc bounce or die ?coti / Btc analysis
target at all time low at 184 sat
There around this area ..can be a small bounce expected
But still not a buy area until you see strength or consolidation there
If the bulls didnt defend this area.. marked sell off will happen so take care if you want buy


COTI targeting 180sats be prepared for it.COTI is in downtrend for quite some time now.
and we might see a last leg down before another wave of alt session.
