COTI Analysis (1D)The price is breaking out of an important trendline and is also reclaiming a key support zone.
⚠️ Make sure to wait for a daily candle to close above the trendline and the key level, and then enter a position on the pullback.
Targets are marked on the chart.
A daily candle close below the invalid
Related pairs

COTI Higher High (All-Time High) Confirmed · 2,612% Pot. ProfitsLet me remind you of one of the classic sayings, "higher lows will lead to higher highs —always."
While some charts are mixed; some projects produce shy lower lows and we don't know if this counts as a true lower low from a TA perspective; other pairs produce lower lows but still have potential for

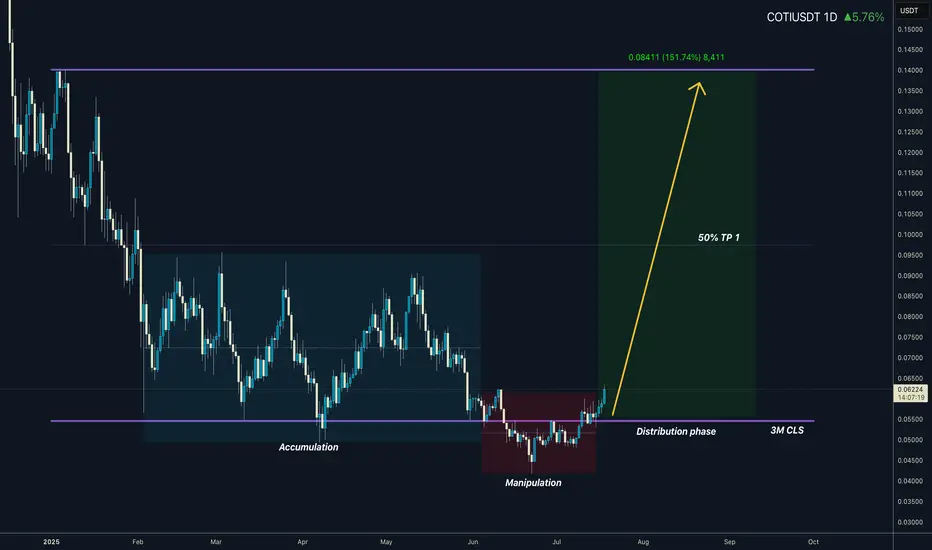
COTIUSDT I 3M CLS I Model 1 I Target Full Range Yo Market Warriors ⚔️
This coin is ready to pump manipulation phase finished — if you’ve been riding with me, you already know:
🎯My system is 100% mechanical. No emotions. No trend lines. No subjective guessing. Just precision, structure, and sniper entries.
🧠 What’s CLS?
It’s the real smart mo
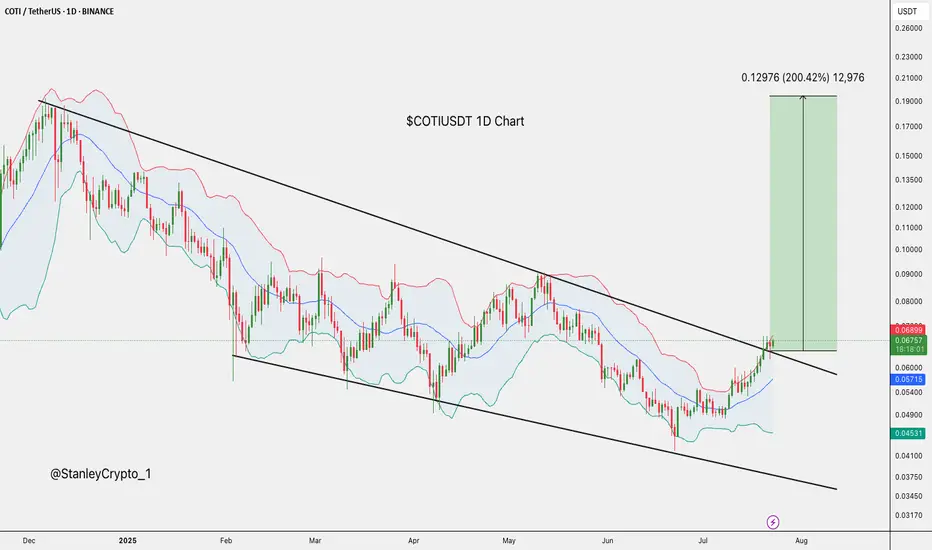
$COTI Breakout Alert COTI just broke out of its long-term downtrend with strong momentum.
If this breakout holds, it could rally toward $0.19443, over 200% upside.
Keep it on your radar.
DYOR, NFA
COTIUSDT 1D#COTI is moving inside a descending channel on the daily chart. In case of a breakout above the channel resistance and the daily SMA100, the targets are:
🎯 $0.07740
🎯 $0.09934
🎯 $0.11708
🎯 $0.13481
⚠️ Always use a tight stop-loss and apply proper risk management.

COTI - Crazy Breakout Soooooon- COTI is trading inside the falling wedge pattern
- Price is currently nearing the resistance trendline,
- A clear breakout of this trendline will push the price higher
- we will enter a long trade after the breakout
Entry Price: 0.06696
Stop Loss: 0.03793
TP1: 0.07746
TP2: 0.10366
TP3: 0.14599

COTI/USDTKey Level Zone: 0.05400 - 0.05470
LMT v2.0 detected.
The setup looks promising—price previously trended upward with rising volume and momentum, then retested this zone cleanly. This presents an excellent reward-to-risk opportunity if momentum continues to align.
Introducing LMT (Levels & Momentum

COTI bullish ideaCOTI reacting with the rest of the market seems to have completed 1 & 2 waves in a possible 5 wave elliot wave structure.
If this holds true, there's an opportunity to catch the next retrace and 3,4,5 waves. Possible entry points I would consider would be at POC or even VAL if there is a decent rea

COTIUSDT // During the time we stay on the green line, the direction is up. The first target is Fibo 1.414, which is 0.06018, the main target is 0.06766. Cut losses below the green line.

COTI/USDT – Approaching Make-or-Break Zone | Multi-Leg Reversal📌 Overview:
COTI is currently at a critical inflection point in its long-term structure. After a prolonged distribution phase since 2021 and a steady decline throughout 2023–2025, price action is now testing a historical support zone that has repeatedly triggered strong reversals. This area could b

See all ideas
Summarizing what the indicators are suggesting.
Oscillators
Neutral
SellBuy
Strong sellStrong buy
Strong sellSellNeutralBuyStrong buy
Oscillators
Neutral
SellBuy
Strong sellStrong buy
Strong sellSellNeutralBuyStrong buy
Summary
Neutral
SellBuy
Strong sellStrong buy
Strong sellSellNeutralBuyStrong buy
Summary
Neutral
SellBuy
Strong sellStrong buy
Strong sellSellNeutralBuyStrong buy
Summary
Neutral
SellBuy
Strong sellStrong buy
Strong sellSellNeutralBuyStrong buy
Moving Averages
Neutral
SellBuy
Strong sellStrong buy
Strong sellSellNeutralBuyStrong buy
Moving Averages
Neutral
SellBuy
Strong sellStrong buy
Strong sellSellNeutralBuyStrong buy
Displays a symbol's price movements over previous years to identify recurring trends.
Frequently Asked Questions
The current price of COTI / TetherUS (COTI) is 0.06000 USDT — it has risen 3.90% in the past 24 hours. Try placing this info into the context by checking out what coins are also gaining and losing at the moment and seeing COTI price chart.
COTI / TetherUS price has fallen by −0.43% over the last week, its month performance shows a 21.19% increase, and as for the last year, COTI / TetherUS has decreased by −49.50%. See more dynamics on COTI price chart.
Keep track of coins' changes with our Crypto Coins Heatmap.
Keep track of coins' changes with our Crypto Coins Heatmap.
COTI / TetherUS (COTI) reached its highest price on Jan 8, 2023 — it amounted to 0.95500 USDT. Find more insights on the COTI price chart.
See the list of crypto gainers and choose what best fits your strategy.
See the list of crypto gainers and choose what best fits your strategy.
COTI / TetherUS (COTI) reached the lowest price of 0.00010 USDT on May 21, 2023. View more COTI / TetherUS dynamics on the price chart.
See the list of crypto losers to find unexpected opportunities.
See the list of crypto losers to find unexpected opportunities.
The safest choice when buying COTI is to go to a well-known crypto exchange. Some of the popular names are Binance, Coinbase, Kraken. But you'll have to find a reliable broker and create an account first. You can trade COTI right from TradingView charts — just choose a broker and connect to your account.
Crypto markets are famous for their volatility, so one should study all the available stats before adding crypto assets to their portfolio. Very often it's technical analysis that comes in handy. We prepared technical ratings for COTI / TetherUS (COTI): today its technical analysis shows the buy signal, and according to the 1 week rating COTI shows the sell signal. And you'd better dig deeper and study 1 month rating too — it's sell. Find inspiration in COTI / TetherUS trading ideas and keep track of what's moving crypto markets with our crypto news feed.
COTI / TetherUS (COTI) is just as reliable as any other crypto asset — this corner of the world market is highly volatile. Today, for instance, COTI / TetherUS is estimated as 9.64% volatile. The only thing it means is that you must prepare and examine all available information before making a decision. And if you're not sure about COTI / TetherUS, you can find more inspiration in our curated watchlists.
You can discuss COTI / TetherUS (COTI) with other users in our public chats, Minds or in the comments to Ideas.