COTI Analysis (1D)The price is breaking out of an important trendline and is also reclaiming a key support zone.
⚠️ Make sure to wait for a daily candle to close above the trendline and the key level, and then enter a position on the pullback.
Targets are marked on the chart.
A daily candle close below the invalidation level will invalidate this analysis.
For risk management, please don't forget stop loss and capital management
Comment if you have any questions
Thank You
COTIUSDT trade ideas

COTI Higher High (All-Time High) Confirmed · 2,612% Pot. ProfitsLet me remind you of one of the classic sayings, "higher lows will lead to higher highs —always."
While some charts are mixed; some projects produce shy lower lows and we don't know if this counts as a true lower low from a TA perspective; other pairs produce lower lows but still have potential for a new all-time high, some pairs produce double-bottoms and the situation becomes mixed; other pairs remain 100% clear. Here we have COTIUSDT with long-term higher lows.
The end of the bear market produced a bottom price that is many times higher compared to the start of the last bull market. A new all-time low (ATL) is simply not a question on this pair. The situation is 100% perfectly clear. Since we have an ultra-strong multiple-years long higher low, we can easily expect a higher high, which simply means a new all-time high (ATH) in the coming months. That's the beauty about TA and Crypto, you can predict the future if you know what to look for.
The easy targets here opens more than 580% profits potential.
COTIUSDT is trading with a full green candle today as it breaks out of a falling wedge pattern. The falling wedge is simply a downtrend. This downtrend is being broken.
On top of the long-term higher lows we have a local higher low, which is between June 2025 and October 2023. This is also long-term but not as long compared to the March 2020 market bottom and all-time low.
All this to say that market conditions are really good for this pair. The chart is super strong. This week we have a full green candle, trading at the top of the range and the session is about to close. When the session closes full green next week will be straight up. You will be witnessing the strongest action on this pair since early 2024 but with a big difference. It will be sustained. In early 2024 the big candles here only lasted three weeks. In 2025 you can have anywhere between 8-16 weeks straight up or even 24-32, etc. Whatever is needed for maximum growth to unravel. You won't be disappointed. You will be happy with the results.
Namaste.

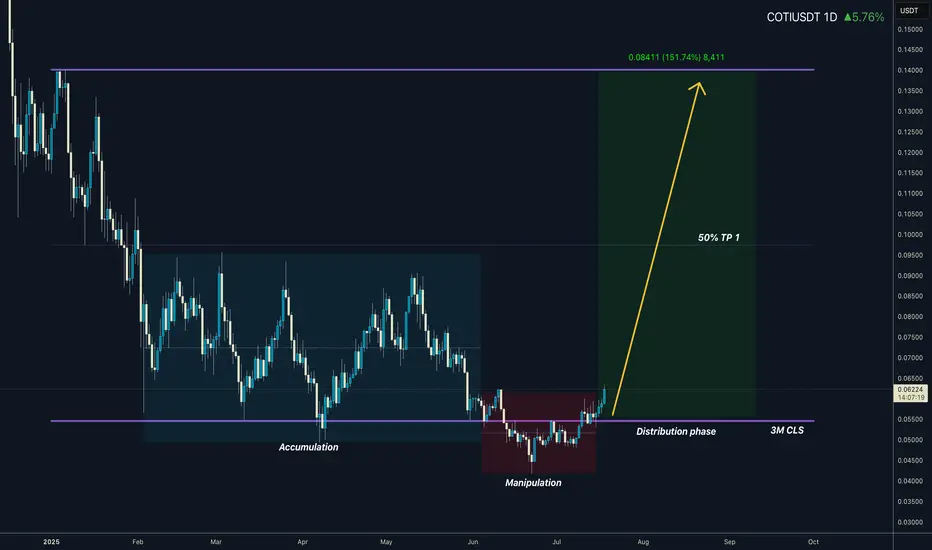
COTIUSDT I 3M CLS I Model 1 I Target Full Range Yo Market Warriors ⚔️
This coin is ready to pump manipulation phase finished — if you’ve been riding with me, you already know:
🎯My system is 100% mechanical. No emotions. No trend lines. No subjective guessing. Just precision, structure, and sniper entries.
🧠 What’s CLS?
It’s the real smart money. The invisible hand behind $7T/day — banks, algos, central players.
📍Model 1:
HTF bias based on the daily and weekly candles closes,
Wait for CLS candle to be created and manipulated. Switch to correct LTF and spot CIOD. Enter and target 50% of the CLS candle.
For high probability include Dealing Ranges, Weekly Profiles and CLS Timing.
Analysis done on the Tradenation Charts
Disclosure: I am part of Trade Nation's Influencer program and receive a monthly fee for using their TradingView charts in my analysis.
Trading is like a sport. If you consistently practice you can learn it.
“Adapt what is useful. Reject whats useless and add whats is specifically yours.”
David Perk aka Dave FX Hunter
💬 Don't hesitate to ask any questions or share your opinions
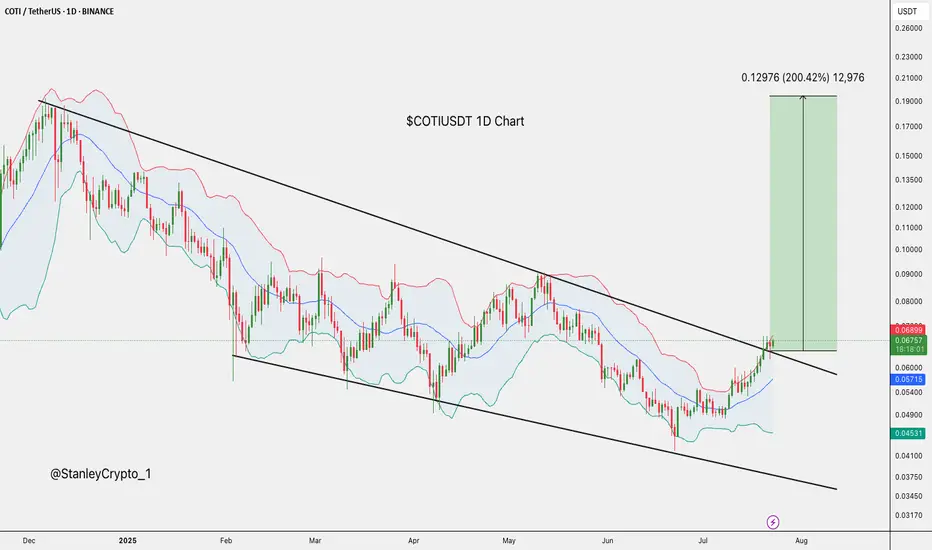
$COTI Breakout Alert COTI just broke out of its long-term downtrend with strong momentum.
If this breakout holds, it could rally toward $0.19443, over 200% upside.
Keep it on your radar.
DYOR, NFA
COTIUSDT 1D#COTI is moving inside a descending channel on the daily chart. In case of a breakout above the channel resistance and the daily SMA100, the targets are:
🎯 $0.07740
🎯 $0.09934
🎯 $0.11708
🎯 $0.13481
⚠️ Always use a tight stop-loss and apply proper risk management.

COTI - Crazy Breakout Soooooon- COTI is trading inside the falling wedge pattern
- Price is currently nearing the resistance trendline,
- A clear breakout of this trendline will push the price higher
- we will enter a long trade after the breakout
Entry Price: 0.06696
Stop Loss: 0.03793
TP1: 0.07746
TP2: 0.10366
TP3: 0.14599
TP4: 0.25150
Don't forget to keep stoploss
Cheers
GreenCrypto

COTI/USDTKey Level Zone: 0.05400 - 0.05470
LMT v2.0 detected.
The setup looks promising—price previously trended upward with rising volume and momentum, then retested this zone cleanly. This presents an excellent reward-to-risk opportunity if momentum continues to align.
Introducing LMT (Levels & Momentum Trading)
- Over the past 3 years, I’ve refined my approach to focus more sharply on the single most important element in any trade: the KEY LEVEL.
- While HMT (High Momentum Trading) served me well—combining trend, momentum, volume, and structure across multiple timeframes—I realized that consistently identifying and respecting these critical price zones is what truly separates good trades from great ones.
- That insight led to the evolution of HMT into LMT – Levels & Momentum Trading.
Why the Change? (From HMT to LMT)
Switching from High Momentum Trading (HMT) to Levels & Momentum Trading (LMT) improves precision, risk control, and confidence by:
- Clearer Entries & Stops: Defined key levels make it easier to plan entries, stop-losses, and position sizing—no more guesswork.
- Better Signal Quality: Momentum is now always checked against a support or resistance zone—if it aligns, it's a stronger setup.
- Improved Reward-to-Risk: All trades are anchored to key levels, making it easier to calculate and manage risk effectively.
- Stronger Confidence: With clear invalidation points beyond key levels, it's easier to trust the plan and stay disciplined—even in tough markets.
Whenever I share a signal, it’s because:
- A high‐probability key level has been identified on a higher timeframe.
- Lower‐timeframe momentum, market structure and volume suggest continuation or reversal is imminent.
- The reward‐to‐risk (based on that key level) meets my criteria for a disciplined entry.
***Please note that conducting a comprehensive analysis on a single timeframe chart can be quite challenging and sometimes confusing. I appreciate your understanding of the effort involved.
Important Note: The Role of Key Levels
- Holding a key level zone: If price respects the key level zone, momentum often carries the trend in the expected direction. That’s when we look to enter, with stop-loss placed just beyond the zone with some buffer.
- Breaking a key level zone: A definitive break signals a potential stop‐out for trend traders. For reversal traders, it’s a cue to consider switching direction—price often retests broken zones as new support or resistance.
My Trading Rules (Unchanged)
Risk Management
- Maximum risk per trade: 2.5%
- Leverage: 5x
Exit Strategy / Profit Taking
- Sell at least 70% on the 3rd wave up (LTF Wave 5).
- Typically sell 50% during a high‐volume spike.
- Move stop‐loss to breakeven once the trade achieves a 1.5:1 R:R.
- Exit at breakeven if momentum fades or divergence appears.
The market is highly dynamic and constantly changing. LMT signals and target profit (TP) levels are based on the current price and movement, but market conditions can shift instantly, so it is crucial to remain adaptable and follow the market's movement.
If you find this signal/analysis meaningful, kindly like and share it.
Thank you for your support~
Sharing this with love!
From HMT to LMT: A Brief Version History
HM Signal :
Date: 17/08/2023
- Early concept identifying high momentum pullbacks within strong uptrends
- Triggered after a prior wave up with rising volume and momentum
- Focused on healthy retracements into support for optimal reward-to-risk setups
HMT v1.0:
Date: 18/10/2024
- Initial release of the High Momentum Trading framework
- Combined multi-timeframe trend, volume, and momentum analysis.
- Focused on identifying strong trending moves high momentum
HMT v2.0:
Date: 17/12/2024
- Major update to the Momentum indicator
- Reduced false signals from inaccurate momentum detection
- New screener with improved accuracy and fewer signals
HMT v3.0:
Date: 23/12/2024
- Added liquidity factor to enhance trend continuation
- Improved potential for momentum-based plays
- Increased winning probability by reducing entries during peaks
HMT v3.1:
Date: 31/12/2024
- Enhanced entry confirmation for improved reward-to-risk ratios
HMT v4.0:
Date: 05/01/2025
- Incorporated buying and selling pressure in lower timeframes to enhance the probability of trending moves while optimizing entry timing and scaling
HMT v4.1:
Date: 06/01/2025
- Enhanced take-profit (TP) target by incorporating market structure analysis
HMT v5 :
Date: 23/01/2025
- Refined wave analysis for trending conditions
- Incorporated lower timeframe (LTF) momentum to strengthen trend reliability
- Re-aligned and re-balanced entry conditions for improved accuracy
HMT v6 :
Date : 15/02/2025
- Integrated strong accumulation activity into in-depth wave analysis
HMT v7 :
Date : 20/03/2025
- Refined wave analysis along with accumulation and market sentiment
HMT v8 :
Date : 16/04/2025
- Fully restructured strategy logic
HMT v8.1 :
Date : 18/04/2025
- Refined Take Profit (TP) logic to be more conservative for improved win consistency
LMT v1.0 :
Date : 06/06/2025
- Rebranded to emphasize key levels + momentum as the core framework
LMT v2.0
Date: 11/06/2025
- Fully restructured lower timeframe (LTF) momentum logic
- Enhanced entry timing for better precision and alignment with key levels

COTI bullish ideaCOTI reacting with the rest of the market seems to have completed 1 & 2 waves in a possible 5 wave elliot wave structure.
If this holds true, there's an opportunity to catch the next retrace and 3,4,5 waves. Possible entry points I would consider would be at POC or even VAL if there is a decent reaction from price, with invalidation below the previous low.

COTIUSDT // During the time we stay on the green line, the direction is up. The first target is Fibo 1.414, which is 0.06018, the main target is 0.06766. Cut losses below the green line.

COTI/USDT – Approaching Make-or-Break Zone | Multi-Leg Reversal📌 Overview:
COTI is currently at a critical inflection point in its long-term structure. After a prolonged distribution phase since 2021 and a steady decline throughout 2023–2025, price action is now testing a historical support zone that has repeatedly triggered strong reversals. This area could be the foundation of a macro bottom formation—or the gateway to further downside if broken.
🔍 Technical Breakdown & Key Price Zones:
🟨 Major Demand Zone (Support Block):
Range: $0.030 – $0.048
This is a historically significant support area, previously acting as a launchpad for bullish impulses.
There is a strong chance of forming a double bottom or even an Inverse Head & Shoulders pattern here on the weekly timeframe, which would hint at a trend reversal if confirmed.
📏 Layered Resistance Levels (Profit-Taking Zones):
1. $0.05600 – Minor resistance, first validation of bullish strength
2. $0.07460 – Previous structural resistance from early 2024
3. $0.08995 – Key breakout level that may trigger mid-term momentum
4. $0.13211 – $0.18230 – Medium-term targets on sustained breakout
5. $0.25157 – $0.41854 – Long-term targets if macro bullish trend forms
🟢 Bullish Scenario (Reversal Setup):
✅ If price holds the $0.030–$0.048 demand zone:
Expect gradual bullish momentum toward $0.05600, followed by confirmation above $0.08995.
Weekly breakout candle with strong volume would confirm reversal structure.
Mid-term price target could reach $0.132 – $0.182, or even higher during an altseason rotation.
🔴 Bearish Scenario (Breakdown Setup):
❌ If the support zone fails:
Price could break below $0.030, exposing $0.0259 or even $0.020 as next downside targets.
This would negate the potential reversal structure and resume the bearish continuation trend.
Traders should wait for a new base or re-accumulation signal before re-entering long positions.
📊 Pattern Focus:
Double Bottom / Inverse Head & Shoulders (Potential Formation)
Descending Channel breakout watch
Volume Drying Up = Possible prelude to trend reversal if volume spikes follow
💡 Trading Strategy:
Aggressive Long Entry: Buy within the yellow support zone, stop-loss below $0.030
Conservative Entry: Wait for breakout and successful retest above $0.056
Bearish Setup: If breakdown occurs, short-term shorts or sidelining recommended
📈 Momentum Outlook:
Weekly structure suggests seller exhaustion is setting in.
Swing reversal is likely if price holds above the support range for the coming weeks.
Gradual accumulation strategy is suitable for swing traders.
🧲 Key Takeaway:
> COTI is entering a golden zone for potential mid-term reversal. If the support holds and a reversal pattern forms, a 200%+ upside is realistic. However, failure to hold this zone could lead to a breakdown and deeper correction. Patience and confirmation are key.
#COTI #COTIUSDT #CryptoAnalysis #AltcoinSeason #DoubleBottom #SupportZone #TrendReversal #TechnicalAnalysis #WeeklyChart #BreakoutWatch

$COTI Approaching Key Long-Term Support!Price is testing a major trendline + demand zone that has held since 2021 👀
If this holds, a move toward $0.09 → $0.108 looks highly probable.
Invalidation below $0.04.
Risk-reward looks 🔥 for long-term swing traders.

COTI/USDT Weekly Analysis – Potential Macro Reversal in PlayThe chart displays a long-term downtrend structure for COTI/USDT, yet a significant accumulation zone is forming around the $0.036–$0.045 range (highlighted in yellow). This area has acted as a key support level multiple times since 2021, suggesting strong demand and a potential bottoming pattern.
🔍 Key Observations:
Macro Support Zone:
Price is currently trading within a strong historical support zone between $0.03607 (multi-year low) and $0.04500, where buyers have consistently stepped in over the past few years.
Potential Reversal Path:
The projected yellow path indicates a bullish scenario with a potential rally from current levels toward a series of resistance levels if a reversal is confirmed.
Major Resistance Levels to Watch:
$0.05046 – Minor local resistance
$0.06500 – Psychological resistance
$0.07403 – Structural level
$0.08998 – Previous rejection zone
$0.12000 – Psychological mid-range target
$0.13210 – Prior support turned resistance
$0.16000–$0.25207 – Key macro targets
$0.46767–$0.69400 – Long-term bullish targets if momentum continues
Bullish Breakout Triggers:
A confirmed breakout above $0.065–$0.074 may trigger momentum-based entries, especially if volume supports the breakout. Sustained price action above $0.12 would further validate the bullish trend reversal.
📉 Risk Management:
This setup is still speculative until a clear reversal structure forms on the weekly timeframe. Invalidation of the setup occurs if weekly candle closes decisively below $0.036.
Conclusion: COTI is currently at a pivotal zone. While the broader trend has been bearish, the current setup offers an attractive risk/reward for mid to long-term bulls if reversal confirmation appears. Watch for bullish weekly structure and volume expansion to validate the thesis.

COTIUSDT 1W AnalysisCOTI ~ 1W Analysis
#COTI Buy gradually from here if you still have confidence in this coin with a short term target of at least 15%+ from here.

COTIUSDT 1D AnalysisCOTI ~ 1D Analysis
#COTI Buy back gradually from here if you still have confidence in this coin with a short term target of at least 15%+ from here.

COTI Multi-Timeframe Setup – Coiling for a Bigger Move?📊 COTI – Multi-Timeframe Breakdown
Daily Chart:
COTI has broken out of a descending channel and completed a clean retest ✅
Now climbing steadily inside an ascending channel 📈
Weekly Chart:
Price is consolidating within a symmetrical triangle—momentum is building ⏳
🔑 Key Support: 0.077 — holding this level is critical for continuation.
👀 Structure is tightening—get ready for a potential breakout move!

COTIUSDT UPDATE
Pattern: Falling Wedge Breakout
Current Price: \$0.08562
Target Price: \$0.1489
Target % Gain: 80.09%
Technical Analysis: COTI has broken out of a long-term falling wedge pattern on the 1D chart. Breakout candle closed above resistance with strong momentum, signaling potential upside continuation.
Time Frame: 1D
Risk Management Tip: Always use proper risk management.

COTI WAVE 3 is coming COTI has completed its initial phases, Wave 1, 2 of Elliot waves and is preparing for Wave 3📈.
Also COTI V2, released recently, aims to revolutionize web3 privacy.
COTI’s market capitalization is $96 million, suggesting substantial potential gains during the upcoming bull market🚀.
This information is not financial advice. Conduct thorough research before making investment decisions.

COTIUSDT 1D AnalysisCOTI ~ 1D Analysis
#COTI Buy after successfully penetrating this resistant line with a short -term target of at least 10%+ from here.

COTI ANALYSIS 📊 #COTI Analysis
✅There is a formation of Descending Channel Pattern in weekly time frame in #COTI.
Also there is a perfect breakout and retest. Now we can expect a bullish move from major support zone. If not the we will see more bearish move and then a reversal in #COTI.
👀Current Price: $0.06390
🎯 Target Price : $0.08660
⚡️What to do ?
👀Keep an eye on #COTI price action and volume. We can trade according to the chart and make some profits⚡️⚡️
#COTI #Cryptocurrency #Breakout #TechnicalAnalysis #DYOR

LIMIT ORDER - $COTI/USDTLIMIT ORDER - $COTI/USDT
Direction: #Short 🔴
Entry Price: 0.062870
Stop Loss: 0.068793
Target 1: 0.060344
Target 2: 0.057817
Target 3: 0.055291
Target 4: 0.052764
Target 5: 0.050238

COTI Breakout Confirmed – Can Bulls Maintain Momentum?
OTC:COTI has successfully broken out from the falling wedge and completed a clean retest, reinforcing the bullish structure. Despite a minor retracement, the overall trend remains strong.
✅ Breakout and retest confirmed, signaling strength
📉 Small pullback observed, but buyers are still in control
📈 If momentum builds, price could push higher and outperform
Watch closely for the next move as momentum unfolds 👀

#COTI/USDT#COTI
The price is moving within a descending channel on the 1-hour frame, adhering well to it, and is on its way to breaking it strongly upwards and retesting it.
We are seeing a rebound from the lower boundary of the descending channel, which is support at 0.06870.
We have a downtrend on the RSI indicator that is about to break and retest, supporting the upward trend.
We are looking for stability above the 100 Moving Average.
Entry price: 0.06870
First target: 0.07471
Second target: 0.09799
Third target: 0.08660

COTI is in the trenches looking for a reversalCOTI is fighting for a bottom and it has a bullish upgrade on its side. Accumulation above invalidation provides a great RR opportunity. Momentum and trend oscillators are suggesting a bullish pivot is in the works.
Full TA: Link in the BIO
