$copperlovely gift by trump i guess
50 ema holding for now
bid here and will look for a deviation below white line

buy copper! buy copper!Trump discounted coppers value over 20% due to 50% tariffs as we know usually is temporary and a negotiating tactic. also copper needed a clear market correction after this years impulse in price. heres the last chance


Long the copper for a potential breaking upWith the expectation of PPI bouncing back from the deep valley because China is launching a 1.3 Trillion infrastructure plan to build the largest hydro dam in the Yarlung Tsangpo Grand Canyon on the Qinghai-Tibet Plateau, the long term global demand of industrial copper is more bullish than last ti

What a turnaround on copper futuresManipulation? Smells like it, but of course, this is just the market we are currently living in.
Let's dig in.
MARKETSCOM:COPPER
COMEX:HG1!
Let us know what you think in the comments below.
Thank you.
75.2% of retail investor accounts lose money when trading CFDs with this provider. You s

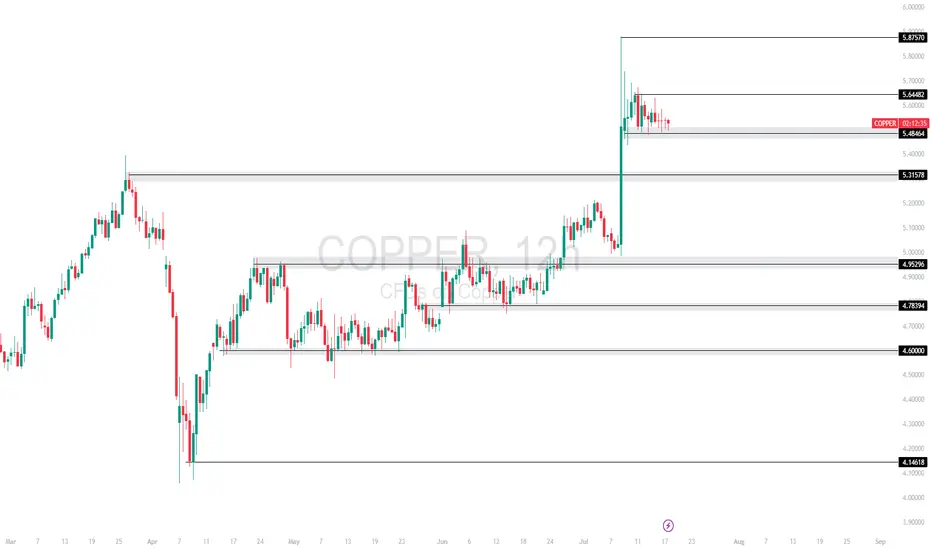
COPPER TECHNICAL ANALYSISCopper spiked into 5.8750 but is now consolidating just below short-term resistance at 5.6448, showing signs of a bullish continuation pattern. Price remains supported at the 5.4864 zone.
Currently trading at 5.4864, with
Support at: 5.4864 / 5.3157 / 4.9929 🔽
Resistance at: 5.6448 / 5.8750 🔼
🔎 Bi
Copper Eyeing Key Reversal Point – Will It Break Above 4.68152 ?Copper is currently hovering near the 4.68152 🔼 resistance after rebounding from the 4.50280 🔽 support. Price is reacting to the 50-period SMA, which is slightly above current levels and may act as a dynamic resistance. The overall structure remains mixed with recent lower highs, but bulls have step

Bullish Consolidation After the copper market exploded higher on the Trump Administration’s 50% tariff headline, the market has been quietly consolidating above the breakout level at 5.33. While above this level the risk is higher, and in case of a break back below the 5.30 level, the risk would be a larger retracement.

XCU/USD: Low-Risk Loot Opportunity!🔥 THE COPPER HEIST: XCU/USD Robbery Plan (Swing/Day Trade) 🔥
🌟 Attention, Market Robbers & Money Makers! 🌟
(Hola! Oi! Bonjour! Hallo! Marhaba!) 🤑💰💸✈️
Based on the 🔥Thief Trading Style🔥, here’s our master heist plan for the XCU/USD "The Copper" Metals Market! This is a high-probability long setup,

Copper Holds Above 14-Year ResistanceFrom a monthly time frame perspective, copper has broken above a major resistance zone defined by consecutive highs dating back to 2011.
The breakout above $5.40 marks a significant technical milestone. A clean move above the $5.87 high could open the door for further upside, potentially targeting

See all ideas
Displays a symbol's price movements over previous years to identify recurring trends.