Copper/gold rising wedgeCopper is stronger than gold for the moment.
Rising volume on rising ratio...gold falling has done this, copper holding its own against the dollar. More systemic problems and this ratio would fail the trend line. Falling interest rates would likely make gold surge not so much for copper if it is a negative economic event. If the event precipitates the falling rates look for a dramatic fail.
CPRUSD trade ideas

COPPER SCALPLTF reversal imo. If it holds the low then this would be a nice Long scalp as i can see far more downside end of this year for Copper purely based on TA.
Seeing Copper not doing so well as an 'inflation' hedge it would make me think we have been in a Recession this entire time, and by the time FED are done hiking rates, most would think Recession starts but it could be a Bear Trap... Careful out there!!

XCUUSD is setting up for longer term drop Hi there
Copper is setting up for crash watch for sharp breakdown and look for sharp sell off.
Good Luck

Copper is ready to breakdown Hi there,
Copper is ready to breakdown for the next leg,
Watch for breakdown and look for short,
Good Luck

Copper Bounce Looks WeakCopper rallied off 61.8% Fibo retrace key level but looks like it will fail and continue lower. A lot of weakness in emerging markets with strong $USD.


Elliott wave Analysis of Dr. CopperCopper is in downtrend from the high of March-07-2022, as per elliott wave analysis the copper seems to be in (corrective) 4th wave. If my analysis and wave counts holds good, then the 4th wave should end below the low of wave 1 which is "4.0346". The 4th wave should clearly show the ABC corrective pattern.
The trade idea is to SHORT COPPER in the 5th wave, there is no way to predict exact point when the 5th wave will start and end. But if the copper price keeps going up respecting 4th wave, we will have a good trade.
Possible reversal from 4th to 5th wave can be determined by superimposing Weekly and Monthly Pivot Points on top of the elliott waves, I expect it to happen in early August. I will post an update whether we have a trade or not, until then keep an eye on Dr. Copper.

Dr Copper: not happyA price action below 3.60 supports a bearish trend direction.
Crossing above this level will negate the bearish stance.
Further bearish trend support below 3.50.
Consolidation price range from 3.45 to 3.55.
Crossing below the 3.45 support might target 3.35.
Crossing above the 3.55 resistance might be the first sign of pending strength.


Short Term Copper 'SELLS' heading into Q4 of 2022I think it's becoming more and more clear that copper sells could extend into the last quarter of the year. Corrective wave 4 seems complete at 0.382 of the second Minor wave count and price is currently in an impulsive bear wave of a lower degree. We should therefore expect Copper prices to plunge to $2.96/lb(-15.4% decline) with some minor bullish price action to around $3.2/lb before eventually finding support at $2.7/lb, representing a -22.42% decline based on the current market price.
As indicated in the chart, this short idea comes into play ONLY WHEN Copper prices drop BELOW $3.35/lb, which is the terminus of the minuette wave 1.
Additionally, I strongly recommend you to review my long term forecast in profile.
Here is a link to my previous Copper forecast.
Disclaimer: The information provided here is only for educational purposes and should NOT be taken as investment advice.

Demand destruction.Hey all,
I don't tend to post my ideas on commodities or Forex, but I thought I'd share my two cents on Copper here as I'm playing it indirectly through FCX; I think Copper is going to go lower. I believe this as commodities went parabolic out of the pandemic, but have since distributed and entered downtrends across the board. Moreover, the FED has made it abundantly clear its mission is to employ all its forces to stimulate demand destruction in its battle to tame inflation. Moreover, as I believe stocks are going to go lower, it simply adds a layer to my thesis that copper will fall as its price tends to mirror equities.

Copper Sell (Short term) - UpdateIn April, I shared my show idea on Copper with 2 main target levels.
I am glad to have seen this play out as expected.
Here is the link to my initial idea
Please leave a like if you would like to see more ideas from me.

COPPER - Is Dead News of copper shortages had the herd rushing in yesterday but alas it looks like COPPER has completed a bearish ABC running flat correction that should see another leg down of capitulation.
The A and the C wave have potentially both closed printing a long wicked gravestone doji - very bearish, showing plenty of selling pressure.
The intermediate C reversed at 0.618 retracement and the minor wave just shy of the 1.618 extension.
I have entered s short position at the close that should compliment my FCX LEAP put.
Not advice.


Copper 1D LONGGGGGGGGGGI took a long trade on Copper today, let's see how far this trade goes!
Entry:3.6120
Sl:3.4691
Tp:3.7081

COPPER Elliott Wave AnalysisThe commodity Copper has recently ended its correction as the Expanding Flat and nowit has started the big impulsive move.
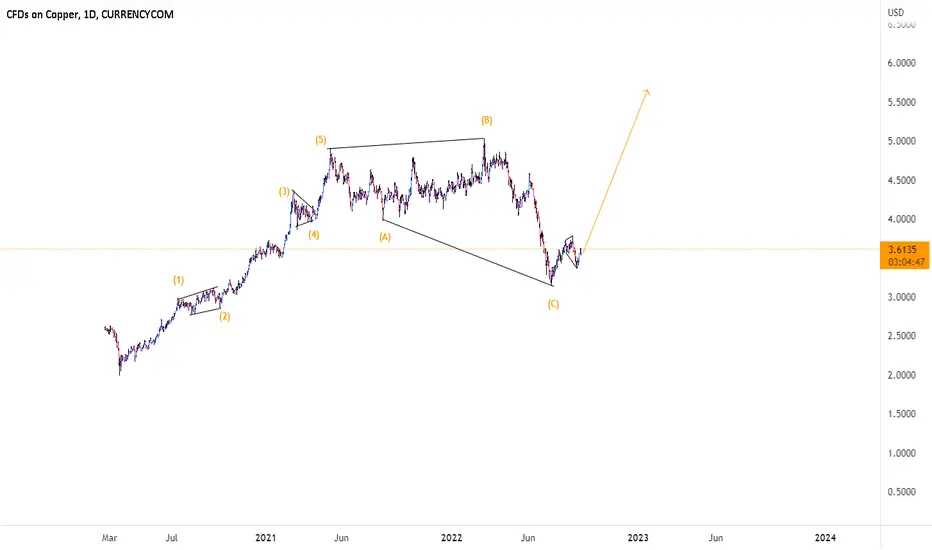
COPPERCOPPER price yet again about to raise massively as we are currently in a corrective wave technically looking out for an impulsive move to $5.03/ lb as price rejected from $3.14/ lb ( (1.618 Fib) and now price is playing above (0.5 Fib)

Copper Potential for bullish momentumOn H4, with the price crossing the ichimoku cloud, we have a bullish bias that the price may rise from the sell entry at 3.6069, which is in line with the 61.8% fibonacci retracement and overlap resistance to the take profit at 3.6774, where the previous swing high and 78.6% fibonacci retracement are. Alternatively, the price may drop to the stop loss at 3.5349, where the swing lows are.
Please be advised that the information presented on TradingView is provided to Vantage (‘Vantage Global Limited’, ‘we’) by a third-party provider (‘Everest Fortune Group’). Please be reminded that you are solely responsible for the trading decisions on your account. There is a very high degree of risk involved in trading. Any information and/or content is intended entirely for research, educational and informational purposes only and does not constitute investment or consultation advice or investment strategy. The information is not tailored to the investment needs of any specific person and therefore does not involve a consideration of any of the investment objectives, financial situation or needs of any viewer that may receive it. Kindly also note that past performance is not a reliable indicator of future results. Actual results may differ materially from those anticipated in forward-looking or past performance statements. We assume no liability as to the accuracy or completeness of any of the information and/or content provided herein and the Company cannot be held responsible for any omission, mistake nor for any loss or damage including without limitation to any loss of profit which may arise from reliance on any information supplied by Everest Fortune Group.

Steve's Gun to Head - Inverse head & shoulder in CopperTrade Idea: Buy Copper
Reasoning: Price action posted a bullish engulfing on the daily chart. A confirmed inverse head & shoulder on the short term charts. Yesterdays dollar weakness likely to assist with further gains in dollar priced assets.
Entry Level: 3.48
Take Profit Level: 3.63
Stop Loss: 3.43
Risk/Reward: 3:1
Disclaimer – Signal Centre. Please be reminded – you alone are responsible for your trading – both gains and losses. There is a very high degree of risk involved in trading. The technical analysis , like all indicators, strategies, columns, articles and other features accessible on/though this site is for informational purposes only and should not be construed as investment advice by you. Your use of the technical analysis , as would also your use of all mentioned indicators, strategies, columns, articles and all other features, is entirely at your own risk and it is your sole responsibility to evaluate the accuracy, completeness and usefulness (including suitability) of the information. You should assess the risk of any trade with your financial adviser and make your own independent decision(s) regarding any tradable products which may be the subject matter of the technical analysis or any of the said indicators, strategies, columns, articles and all other features

Copper Potential For Bearish ContinuationOn h4, with the price breaking the descending trendline and there is a golden cross, we have a bullish bias that the price may rise from the buy entry at 3.4507, where the 23.6% fibonacci retracement is to the take profit at 3.5515, where the50% fibonacci retracement and previous swing lows are. Alternatively, the price may drop to the stop loss at 3.3749, where the swing low is.
Please be advised that the information presented on TradingView is provided to Vantage (‘Vantage Global Limited’, ‘we’) by a third-party provider (‘Everest Fortune Group’). Please be reminded that you are solely responsible for the trading decisions on your account. There is a very high degree of risk involved in trading. Any information and/or content is intended entirely for research, educational and informational purposes only and does not constitute investment or consultation advice or investment strategy. The information is not tailored to the investment needs of any specific person and therefore does not involve a consideration of any of the investment objectives, financial situation or needs of any viewer that may receive it. Kindly also note that past performance is not a reliable indicator of future results. Actual results may differ materially from those anticipated in forward-looking or past performance statements. We assume no liability as to the accuracy or completeness of any of the information and/or content provided herein and the Company cannot be held responsible for any omission, mistake nor for any loss or damage including without limitation to any loss of profit which may arise from reliance on any information supplied by Everest Fortune Group.

COPPER Potential for Bearish DropOn H4, with the price moving below the ichimoku cloud, we have a bearish bias that the price may drop form the sell entry at 3.3747, where the swing low and 61.8% fibonacci retracement are to the take profit at 3.2362, where the swing lows are. Alternatively, the price may rise to the stop loss at 3.4543, which is in line with the 23.6% fibonacci retracement and overlap resistance.
Please be advised that the information presented on TradingView is provided to Vantage (‘Vantage Global Limited’, ‘we’) by a third-party provider (‘Everest Fortune Group’). Please be reminded that you are solely responsible for the trading decisions on your account. There is a very high degree of risk involved in trading. Any information and/or content is intended entirely for research, educational and informational purposes only and does not constitute investment or consultation advice or investment strategy. The information is not tailored to the investment needs of any specific person and therefore does not involve a consideration of any of the investment objectives, financial situation or needs of any viewer that may receive it. Kindly also note that past performance is not a reliable indicator of future results. Actual results may differ materially from those anticipated in forward-looking or past performance statements. We assume no liability as to the accuracy or completeness of any of the information and/or content provided herein and the Company cannot be held responsible for any omission, mistake nor for any loss or damage including without limitation to any loss of profit which may arise from reliance on any information supplied by Everest Fortune Group.

Copper Forecast.Copper is falling to 3.5000, 3.4105, and 3.3325. We are using ABCs to the highs so make sure you have a good oscillator. Nothing is guaranteed for accuracy.

Copper SellCopper has been rejected from the Resistance Zone.
Confirmation with Pinbar + Engulfing Bearish Candle = sellers in control.
Oscillators indicate a dead cross favouring the sell side.
Trade on chart.
