Copper is facing bullish pressure Copper prices are facing bullish pressure from our first support level, in line with our 61.8% fibonacci retracement, graphical support area where we could see a bounce above this level to our first resistance target. Stochastic is showing signs of bullish pressure as well, in line with our bullish bias.
CPRUSD trade ideas

Copper prices are testing support, potential bounce Copper prices are facing bullish pressure from our first support level, in line with our 50% fibonacci retracement, graphical support area and 100% fibonacci extension where we could see a bounce above this level to our first resistance target. Stochastic is showing signs of bullish pressure as well, in line with our bullish bias.

Copper prices are approaching support, potential bounceCopper prices are facing bullish pressure from our first support level, in line with our 50% fibonacci retracement, graphical support area and 7100% fibonacci extension where we could see a bounce above this level to our first resistance target.Stochastic is showing signs of bullish pressure as well, in line with our bullish bias.

Copper prices are approaching support, potential bounce Copper prices bounced nicely from our support level previously. We maintain a bullish view on Copper, prices are facing bullish pressure from our first support level, in line with our 61.8% fibonacci retracement, graphical support area and 78.6%, 161.8% fibonacci extension where we could see a bounce above this level to our first resistance target.Stochastic is showing signs of bullish pressure as well, in line with our bullish bias.

Copper prices could see a further upside Copper prices bounced nicely from our support level previously. We maintain a bullish view on Copper, prices are facing bullish pressure from our first support level, in line with our 61.8% fibonacci retracement, graphical support area and 161.8% fibonacci extension where we could see a bounce above this level to our first resistance target. Ichimoku cloud and EMA are showing signs of bullish pressure as well, in line with our bullish bias.

Copper prices are approaching support, potential bounce We maintain a bullish view on Copper. Prices are approaching our first support level, in line with our 61.8% fibonacci retracement, graphical support area and 161.8% fibonacci extension where we could see a bounce above this level to our first resistance target. Stochastic is showing signs of bullish pressure as well, in line with our bullish bias.

Copper is approaching supoprt, potential bounce We maintain a bullish view on Copper. Copper prices bounced nicely above our first support level previously. Currently, prices are approaching our first support level, in line with our 61.8% fibonacci retracement, graphical support area and 61.8% fibonacci extension where we could see a bounce above this level to our first resistance target. Ichimoku cloud is showing signs of bullish pressure as well, in line with our bullish bias.

Copper is testing support, potential bounce
We maintain a bullish view on Copper. Currently, copper prices are testing our first support, in line with our 61.8% fibonacci retracement, graphical support area and 161.8% fibonacci extension where we could see a bounce above this level to our first resistance target. Stochastic is showing signs of bullish pressure as well, in line with our bullish bias.

Copper is approaching support, potential bounce We maintain a bullish view on Copper. Currently, copper prices are testing our first support, in line with our 61.8% fibonacci retracement, graphical support area and 100% fibonacci extension where we could see a bounce above this level to our first resistance target. Ichimoku cloud is showing signs of bullish pressure as well, in line with our bullish bias.

Copper is approaching support, potential bounce We maintain a bullish view on Copper. Currently, copper prices are testing our first support, in line with our 61.8% fibonacci retracement, graphical support area and 100% fibonacci extension where we could see a bounce above this level to our first resistance target. A break above our upside confirmation level could provide the bullish acceleration to our first resistance target. Ichimoku cloud is showing signs of bullish pressure as well, in line with our bullish bias.

COPPER (XCU/USD) – Week 11 – Will the resistance hold?Copper moved slow last week and at the moment is in a middle of a consolidation pattern.
In the coming days, we expect the price to continue its lazy movement towards the resistance area highlighted on the chart.
In our opinion, the chances for a new drop will increase from that point, which may push the price around the liquidity pool located around the 3.80 area.
Trade with care.
Best regards,
Financial Flagship
Disclaimer: The analysis provided is purely informative and it should not be used as financial advice. Remember that you need a plan before you start trading; so, take this knowledge and use it as a guidebook that will ultimately help you understand the market and easily predict your next move.

Copper prices are approaching support, potential bounce Copper prices are approaching our first support, in line with our 61.8% fibonacci retracement, graphical support area and 100% fibonacci extension where we could see a bounce above this level to our first resistance target. A break above our upside confirmation level could provide the bullish acceleration to our first resistance target. Ichimoku cloud is showing signs of bullish pressure as well, in line with our bullish bias.

Short coppercopper has made a double top at 4.12 which i believe is bearish and early next week it will definitely challenge the 4 mark. Because of this i am expecting a drop in s&p to around the 3800 mark some time next week

Copper is appraoching resistance, potential reversalCopper prices are approaching our first resistance, in line with our descending trend line where we could see a further drop below this level. Stochastic is approaching resistance as well, in line with our bearish bias.


Copper prices are appraoching resistance, potential reversal Copper prices are approaching our first resistance, in line with our descending trend line where we could see a further drop below this level. A break below our downside confirmation level could see a further drop to our first support target. Ichimoku cloud are showing signs of bearish pressure as well, in line with our bearish bias.

Copper prices remain under bearish pressure
Copper prices reversed nicely from our first resistance and are facing bearish pressure from our descending trend line where we could see a further drop below this level. A break below our downside confirmation level could see a further drop to our first support target. Ichimoku cloud and 20 EMA are showing signs of bearish pressure as well, in line with our bearish bias.

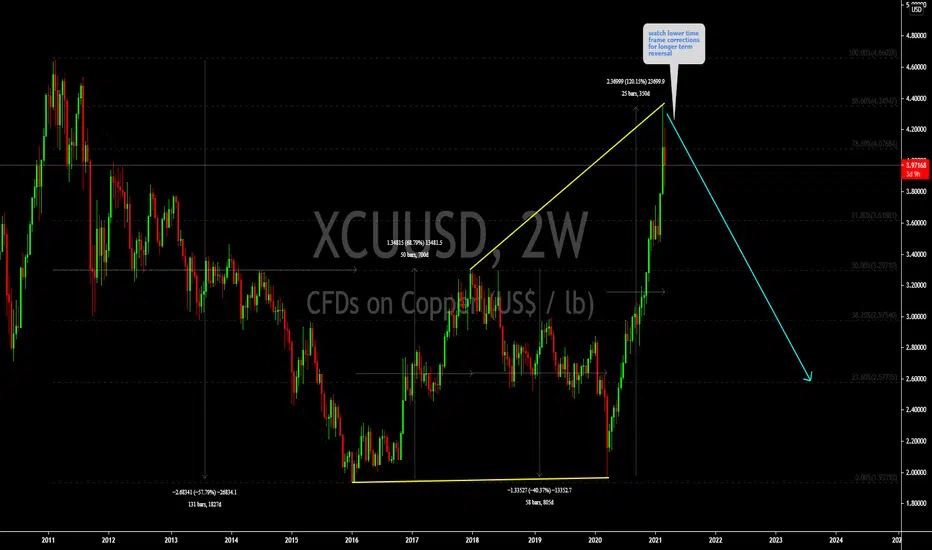
XCUUSD Copper is setting up for longer term drop Hi there,
Copper is struggling to push more higher and setting up for longer term drop.
Watch lower time frame price action and corrections for sell.
Good Luck
CopperThe Copper after COVID-19 underwent changes, this utility metal use in Electronic devices, Telecom industries, Kitchen appliance and … . due to quarantine and preferring online jobs and increasing communicating between firms via internet and working from home, The online businesses and works developed and the producing Electronic instruments and telecom infrastructures raised.
Now we are in highest value for this metal and countries started to vaccination of all people, So it seems be better for traders to going to short. I think it will has a correction during the next couple of weeks.

Copper prices are facing bearish pressure, potential reversalCopper prices are reversing nicely from our first resistance and facing bearish pressure from our descending trend line where we could see a reversal below this level. Ichimoku cloud and 20 EMA are showing signs of bearish pressure as well, in line with our bearish bias.

COPPER (XCU/USD) – Week 10 – Is the pullback over?Copper respected our previous analysis and erased 2 weeks of gains reaching the liquidity pool that is highlighted on the chart. From there the price found some support and it looks like it’s gaining some bullish momentum.
Still early days, but we are expecting the price to increase and head towards the resistance level that we highlighted on the chart. Don’t forget that at this point we strongly need a bigger corrective structure to develop, so the bullish trend could be short-lived.
Trade with care.
Best regards,
Financial Flagship
Disclaimer: The analysis provided is purely informative and it should not be used as financial advice. Remember that you need a plan before you start trading; so, take this knowledge and use it as a guidebook that will ultimately help you understand the market and easily predict your next move.

Copper Short SetupCopper Short Setup
🔵 Entry: 4.0263
🟢 TP & RR: $3.8877 (1.89)
⛔ Stop Loss: $4.0996
Trade Reasons:
✔️ Position in direction of the trend
✔️ Price reversed at the upper diagonal trend line

Copper prices are facing bearish pressure, potential reversalCopper prices are facing bearish pressure from our descending trend line and our first resistance where we could see a reversal below this level. Ichimoku cloud and 20 EMA are showing signs of bearish pressure as well, in line with our bearish bias.
