Copper is facing bearish pressure Price is facing bearish pressure from our first resistance, in line with our 78.6% fibonacci retracement and 127.2% fibonacci extension, where we could see a further downside from here towards 1st support at 2.8008. Ichimoku cloud is showing signs of bearish pressure as well.
Trading CFDs on margin carries high risk.
Losses can exceed the initial investment so please ensure you fully
understand the risks.
CPRUSD trade ideas


XCUUSD is facing pressure 1st resistance Price is facing bearish pressure from our first resistance, in line with our 100% fibonacci retracement and 127.2% fib retracement, where we could see further downside from here towards 1st support at 2.8008. Both 20 period EMA and Ichimoku cloud are showing signs of bearish pressure as well.

XCUUSD facing bearish pressure from 1st resistance ! Price is facing bearish pressure from our first resistance, in line with our 61.8% fibonacci retracement and 76.4% fib retracement, where we could see a reversal below this level. Take note that our 20 period EMA and Ichimoku cloud are showing signs of bullish pressure as well.


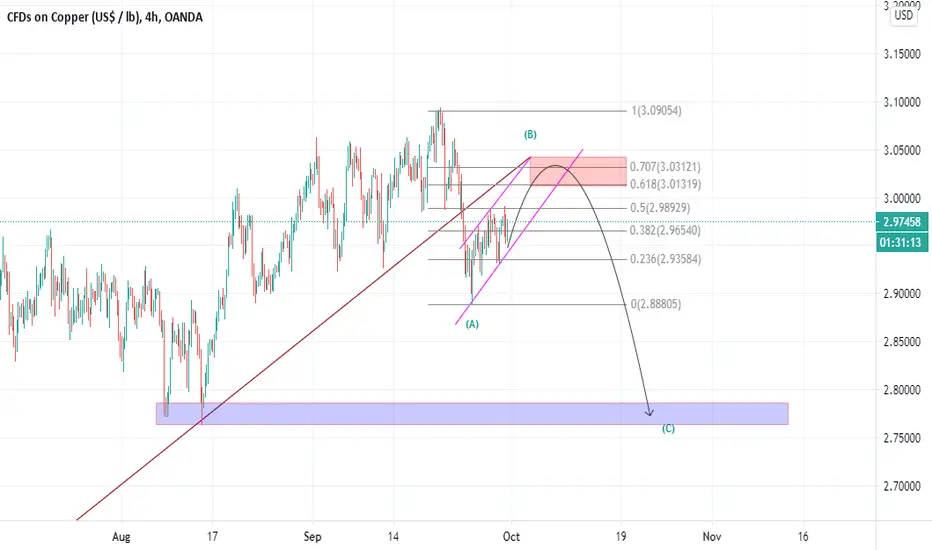
Copper - Short Idea. Bearish Flag?
Divergence on the daily chart.
Doji on 6 hour chart.
It's just so darn pretty.
I'm short.
"What is from the Earth is of the greatest worth"
-Bob Marley

XCUUSD is facing pressure from trendline and 1st resistance Price is facing bearish pressure from our first resistance, in line with our 61.8% fibonacci retracement, horizontal pullback resistance and 127.2% fibonacci extension where we could see a reversal below this level. Our 20 period EMA and Ichimoku cloud are showing signs of bearish pressure as well.

XCUUSD: Potential Bearish ContinuationLast night daily candle price action signaling a possible Bearish reversal. Am looking for a H4 Bearish close to trigger a SHORT entry for Bearish continuation
DISCLAIMER:
Any opinions, analyses discussed in this presentation are just my personal opinion and do not constitute investment advice.
I do not accept liability for any loss or damage, including without limitation to, any loss of profit, which may arise directly or indirectly from use of or reliance on such information.
PRICE ACTION only tell half the story. The other key half is VOLUME. For VOLUME drive price.


20.09.29 CopperHello Traders!
Please support this idea with a LIKE if you find it useful.
Copper, 2H.
- This post does not provide financial advice. It is for educational purposes only.

XCUUSD is facing pressure from trendline and 1st resistance Price is facing bearish pressure from our first resistance, in line with our 50% fibonacci retracement, horizontal pullback resistance and 127.2% fibonacci extension where we could see a reversal below this level. Our 20 period EMA and Ichimoku cloud are showing signs of bearish pressure as well.

XCUUSD facing bearish pressure from 1st resistance !
Price is facing bearish pressure from our first resistance, in line with our 50% fibonacci retracement, horizontal pullback resistance and 127.2% fibonacci extension where we could see a reversal below this level. Our 20 period EMA and Ichimoku cloud are showing signs of bearish pressure as well.

More room for growth in copper?I believe Copper might continue to win as the markets go down. Let's see.
This is not financial advice please consider your own Due Diligence and Risk Management.

XCU USD SELL (COPPER - US DOLLAR)Hi there. Price is forming a continuation pattern to the downside. Wait for the price to complete the pattern and watch strong price action for sell.

Copper on stage for a declineCopper forms an ascending triangle; some patience is needed for break the purple support line; below some large spec. are stunning around because of overdone long. Act on your own opinion

Copper is approaching resistance, potential reversal!Price is facing bearish pressure from our first resistance, in line with our 50% fibonacci retracement, horizontal pullback resistance and 127.2% fibonacci extension where we could see a reversal below this level. Our 20 period EMA and Ichimoku cloud are showing signs of bearish pressure as well.
Trading CFDs on margin carries high risk.
Losses can exceed the initial investment so please ensure you fully understand the risks


Copper is facing bearish pressure, potential reversal!Price is facing bullish pressure from our first resistance where we could see a reversal below this level to our first support level.
Trading CFDs on margin carries high risk.
Losses can exceed the initial investment so please ensure you fully understand the risks

short on trend breakIve taken a small short on this as with the moving average cross over and break snd retest of trend think its time to take a short

Copper is facing bullish pressure, potential bounce! Price is facing bullish pressure from our first support in line with our ascending trend line, horizontal swing low support, 127.2%, 61.8% fibonacci extension and 61.8% fibonacci retracement where we could see a bounce above this level to our first resistance level. Stochastic is approaching support as well.
Trading CFDs on margin carries high risk.
Losses can exceed the initial investment so please ensure you fully understand the risks

Copper is testing support, potential bounce! Price is facing bullish pressure from our first support in line with our ascending trend line, horizontal swing low support, 1.272% fibonacci extension and 61.8% fibonacci retracement where we could see a bounce above this level to our first resistance level. Stochastic is approaching support as well.
Trading CFDs on margin carries high risk.
Losses can exceed the initial investment so please ensure you fully understand the risks

Copper could see a pullback to test support Price is facing bearish pressure from our first resistance in line with our 78.6% fibonacci extension and 127.2% fibonacci retracement where we could see a reversal below this level. Stochastic is facing bearish pressure from our resistance as well.
Trading CFDs on margin carries high risk.
Losses can exceed the initial investment so please ensure you fully understand the risks
