CROUSDT.P trade ideas

CRO Hello friends ,
CRO seems to be going through a full uptrend in the next 2 months. I am happy for you to express your opinion.
Thankful


Crypto.com Coin (CRO) - February 3Hello?
Dear traders, nice to meet you.
"Like" is a huge force for me.
By "following" you can always get new information quickly.
Thank you for always supporting me.
-------------------------------------------------- -----
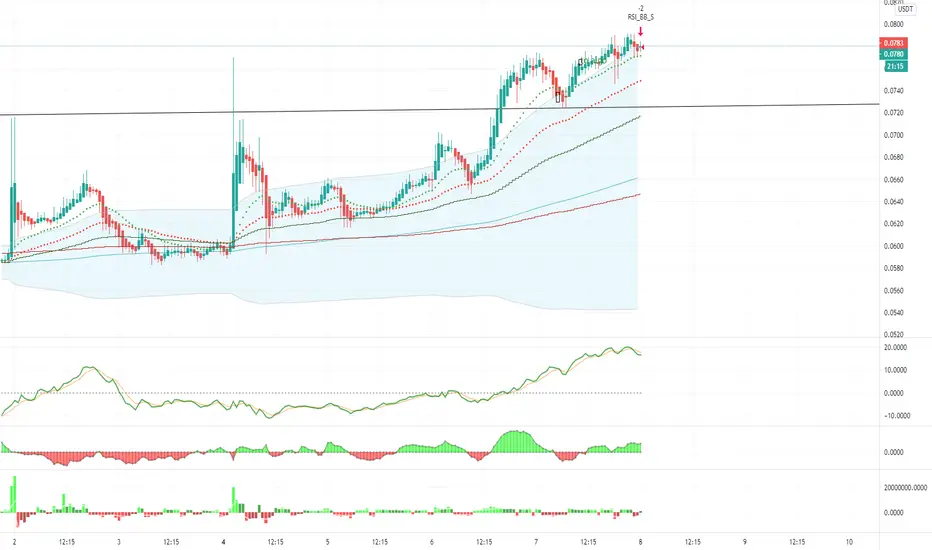
You should watch for any movement that deviates from the important support zone, 0.054223-0.073434.
If it falls from the 0.054223 point, a Stop Loss is required to preserve profit and loss.
It is important to deviate from the downtrend line (3) at this point.
-------------------------------------------------- -------------------------------------------
** All indicators are lagging indicators.
So, it's important to be aware that the indicator moves accordingly with the movement of price and volume.
Just for convenience, we are talking upside down for interpretation of the indicators.
** The wRSI_SR indicator is an indicator created by adding settings and options from the existing Stochastic RSI indicator.
Hence, the interpretation is the same as the conventional Stochastic RSI indicator. (K, D line -> R, S line)
** The OBV indicator was re-created by applying a formula from the DepthHouse Trading indicator, an indicator that oh92 disclosed. (Thank you for this.)
** Check support, resistance, and abbreviation points.
** Support or resistance is based on the closing price of the 1D chart.
** All explanations are for reference only and do not guarantee profit or loss on investment.
Explanation of abbreviations displayed on the chart
R: A point or section of resistance that requires a response to preserve profits
S-L: Stop Loss point or section
S: A point or segment that can be bought for profit generation as a support point or segment
(Short-term Stop Loss can be said to be a point where profits or losses can be preserved or additionally entered through installment transactions. It is a short-term investment perspective.)
GAP refers to the difference in prices that occurred when the stock market, CME, and BAKKT exchanges were closed because they do not trade 24 hours a day.
G1: Closed price
G2: Market price at the time of opening
(Example) Gap (G1-G2)


CRO Bullish Swing TradeCrypto.com is the perfect bullish swing trade for me BECAUSE
A) I use this app daily and believe in the project. (crypto earn, exchange, metal visa card)
B) The chart/TA line up well and point to a great risk to reward ratio.
Trading Plan: 4H Chart
1) Overall Trend: Bullish
2) Bullish Divergence on the MACD, RSI is coiling up into a triangle and has found support here multiple times
3) Supports are at .06 cents and .0565 cents. If these break, we can easily see .02 cents where I will accumulate more for the long term in hopes of potentially getting the 5% cashback card.
4) Bullish Gartley Harmonic Pattern
5) Only negative evidence I've gathered is that the daily/monthly timeframes do not align with this idea. Although this is a monthly trade and the monthly chart doesn't align, I maintain a bullish bias on cryptocurrency for the coming months as a good hedge against the trillions of USD dollars coming into circulation.
6) Main sell target for me is at 14 cents or the .236 fib retracement level. For the less risk adverse traders, sell at 10 cents or the .618 fib retracement zone and get your initial investment back and let the profits ride out or lock it up into crypto earn and get 12% CRO rewards for 5 to 10 years. I see this project as the Amazon of crypto right now with there marketing and products being offered. They are great at adapting to the market conditions and haven't been super profitable because of their referral bonuses and exchange giveaways, but once they capture a large majority of new crypto investors they will become highly profitable and they are now offering loans on crypto.
7) We have a 2-12 month time period for this trade setup and will continue to analyze the market conditions each month to determine where we are for the trend of crypto markets. Our accumulated CRO will be stored in the CRO 2% flexible earn while waiting for sell targets to be hit.
The main youtubers I follow for technical analysis are *Mitch Ray for trading related videos and also *Benjamin Cowen for logarithmic charts on Bitcoin and Ethereum. I highly suggest that new investors follow these channels to get a better understanding of crypto as a whole. After all, crypto has changed my life and it has the potential to change yours.
Thank you and good luck my future millionaire friends. :)

CROUSDT longRisk warning, disclaimer: the above is a personal market judgment based on published information and historical chart data on Tradingview, all analysis is only subjective. Hope investors consider, I am not responsible for your investment decision. Thank you.
Good luck!

CROUSDT ://maybe one more dip then ripa lot of reasons not a big fan of cro but many signes r ligning up for a pump.
_hgm


Crypto.com Coin (CRO) - January 27Hello?
Dear traders, nice to meet you.
"Like" is a huge force for me.
By "following" you can always get new information quickly.
Thank you for always supporting me.
-------------------------------------------------- -----
We must see if it can rise above the 0.073434 point.
If it falls, you need to make sure you get support at 0.065042.
It remains to be seen if there is any move to gain support at 0.073434 and break above the downtrend line (3).
The 0.054223-0.073434 section is an important section as the Volume Profile section.
If there is a fall in this section, you need Stop Loss to preserve profit and loss.
However, since it is also a section where you can buy, you need to trade carefully.
-------------------------------------------------- -------------------------------------------
** All indicators are lagging indicators.
So, it's important to be aware that the indicator moves accordingly with the movement of price and volume.
Just for convenience, we are talking upside down for interpretation of the indicators.
** The wRSI_SR indicator is an indicator created by adding settings and options from the existing Stochastic RSI indicator.
Hence, the interpretation is the same as the conventional Stochastic RSI indicator. (K, D line -> R, S line)
** The OBV indicator was re-created by applying a formula from the DepthHouse Trading indicator, an indicator that oh92 disclosed. (Thank you for this.)
** Check support, resistance, and abbreviation points.
** Support or resistance is based on the closing price of the 1D chart.
** All explanations are for reference only and do not guarantee profit or loss on investment.
Explanation of abbreviations displayed on the chart
R: A point or section of resistance that requires a response to preserve profits
S-L: Stop Loss point or section
S: A point or segment that can be bought for profit generation as a support point or segment
(Short-term Stop Loss can be said to be a point where profits or losses can be preserved or additionally entered through installment transactions. It is a short-term investment perspective.)
GAP refers to the difference in prices that occurred when the stock market, CME, and BAKKT exchanges were closed because they do not trade 24 hours a day.
G1: Closed price
G2: Market price at the time of opening
(Example) Gap (G1-G2)


Crypto.com Coin (CRO) - January 19Hello?
Dear traders, nice to meet you.
"Like" is a huge force for me.
By "following" you can always get new information quickly.
Thank you for always supporting me.
-------------------------------------------------- -----
It remains to be seen if it can rise above the 0.085786 point and maintain the uptrend.
If it falls at 0.028733, it is a short-term stop loss.
If it falls from 0.073434, you need a Stop Loss to preserve profit or loss.
However, if it moves sideways between 0.054223-0.073434, new purchases are possible, so you should consider a buying strategy for this.
It remains to be seen if volatility around January 22 can break above the 0.095739 point, breaking the downtrend line.
-------------------------------------------------- -------------------------------------------
** All indicators are lagging indicators.
So, it's important to know that the indicator moves accordingly with the movement of price and volume.
Just for convenience, we are talking upside down for interpretation of the indicators.
** The wRSI_SR indicator is an indicator created by adding settings and options from the existing Stochastic RSI indicator.
Hence, the interpretation is the same as the conventional Stochastic RSI indicator. (K, D line -> R, S line)
** The OBV indicator was re-created by applying a formula from the DepthHouse Trading indicator, an indicator that oh92 disclosed. (Thank you for this.)
** Check support, resistance, and abbreviation points.
** Support or resistance is based on the closing price of the 1D chart.
** All explanations are for reference only and do not guarantee profit or loss on investment.
Explanation of abbreviations displayed on the chart
R: A point or section of resistance that requires a response to preserve profits
S-L: Stop Loss point or section
S: A point or segment that can be bought for profit generation as a support point or segment
(Short-term Stop Loss can be said to be a point where profits or losses can be preserved or additionally entered through installment transactions. It is a short-term investment perspective.)
GAP refers to the difference in prices that occurred when the stock market, CME, and BAKKT exchanges were closed because they do not trade 24 hours a day.
G1: Closed price
G2: Market price at the time of opening
(Example) Gap (G1-G2)

CONFIGURATION D'ACHAT $CRO EN WEEKLY 70% À 100% - REBOND SUR LE SUPPORT AVEC FORCE ACCOMPAGNE DE VOLUME
- REBOND SUR LE SUPPORT BOUGIE MARTEAU TRÈS BELLE MÈCHE

CRO/USDTIf the market conditions are positive and there is no bad news or we do not see a sharp drop in BTC, the CRO can reach the specified targets ... trade patiently and intelligently .. Good luck friends✌

crousdtThis is its price channel, and its price is now considered excellent for those who want to invest it.


$CROUSDT breaking 0.09c then its going to shoot up $BTC $CRO$CROUSDT breaking 0.09c then its going to shoot up $BTC $CRO

CRO USDT://RANDOM but looks like a nudge from btc she runs, HARDi gotta say in the short term CRO looks primed to run hard. Resistance has definitely flipped to mostly positive cash flow to market cap. ETH n Fiat r up with BTC pairs down. This thing consolidated, for the most part, for a bit now so look for a BTC pump for the go sign. Take profits liberally and use to re buy ur HODLs
_HGM
The CRO's LIVERMORE SPECULATIVE CHARTWhile everyone is hatin' on CRO and super bearish even saying cro is dead, I decide to bet against the contrarian.. I think right now CRO is pulling the "Livermore Speculative" pattern.. it may or may not be the bottom, regardless I think strong upside will happen again pretty soon!
img:
jstradingnotes.files.wordpress.com

Correction Looks Completei would give it till the end of the month to but back in 100% but for now, DCAing between $0.05-0.08 isn't so bad.

Crypto.com Coin (CRO) - December 19Hello?
Dear traders, nice to meet you.
"Like" is a huge force for me.
By "following" you can always get new information quickly.
Thank you for always supporting me.
-------------------------------------------------- -----
You'll have to see if you can Sideways on the 0.054223-0.073434 section.
I think that below the 0.054223 point is the bottom section.
So, if you fall below the 0.054223 point, you should stop trading and check the situation.
The current downtrend does not seem to have subsided.
In order for the downtrend to subside, it needs to form at least the box interval.
Accordingly, the wave must be completed.
If it rises above 0.073434 point, I think there is a possibility to touch the uptrend line (4) near 0.095739 point.
Therefore, careful trading is necessary.
-------------------------------------------------- -------------------------------------------
** All indicators are lagging indicators.
So, it's important to know that the indicator moves accordingly with the movement of price and volume.
Just for convenience, we are talking upside down to interpret the indicators.
** Check support, resistance, and abbreviation points.
** Support or resistance is based on the closing price of the 1D chart.
** All explanations are for reference only and do not guarantee profit or loss on investment.
Explanation of abbreviations displayed on the chart
R: A point or section of resistance that requires a response to preserve profits
S-L: Stop-Loss point or section
S: A point or segment that can be bought for profit generation as a support point or segment
(Short-term Stop Loss can be said to be a point where profits and losses can be preserved or additionally entered through installment trading. You should trade from a short-term investment perspective.)


Accumilation / Re-entry Zone for CRO (Market Cycle Structure)CRO appears to be rounding off, meeting with pre-Bullrun support levels.
There is still room for a 15-22% move to the downside before the floor would be met, so trade cautiously. Cost averaging may be the best approach with this one.
Long term future for the company is still strong with news of expansion across multiple new countries.
It's worth bearing in mind that a lot of hope has been lost by a large number of CRO supporters and early investors. However, CRO has secured its place in the market, and will very likely ride off of the back of Bitcoins success if and when it breaks above it's previous ATH ($19,665).
With a large marketing budget and an attractive domain, it's not hard to believe that there may be a second CRO bull-run.
If so, the next few weeks will make for a perfect accumulation zone, if the TA is to be correct.
