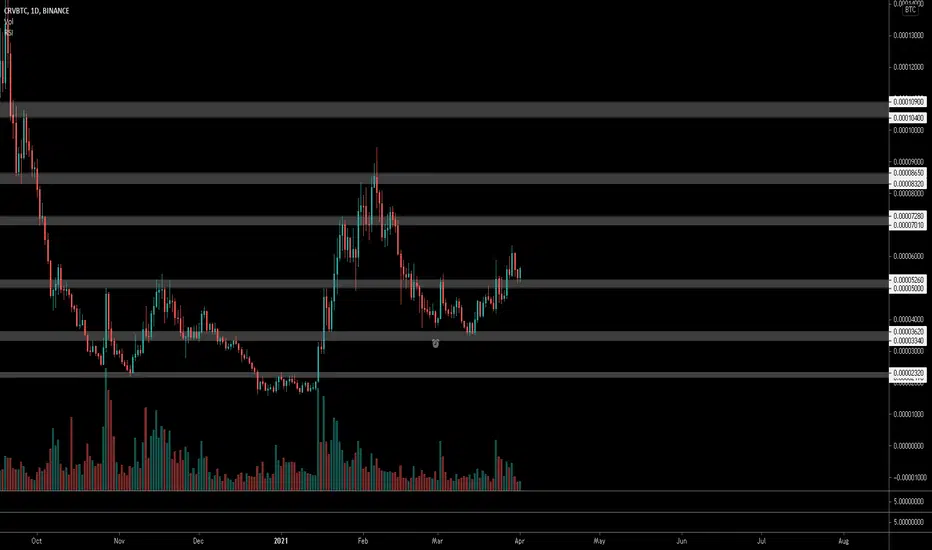
CRV vs USD & CRV vs BTC - good to have in portfolio😉Hello! CRV (doesn't matter in USD or BTC) formed CUP & HANDLE pattern!
It is worth considering the following when detecting cup and handle patterns:
Length: Generally, cups with longer and more "U" shaped bottoms provide a stronger signal. Avoid cups with a sharp "V" bottoms.
Depth: Ideally, the cup should not be overly deep. Avoid handles that are overly deep also, as handles should form in the top half of the cup pattern.
Volume: Volume should decrease as prices decline and remain lower than average in the base of the bowl; it should then increase when the stock begins to make its move higher, back up to test the previous high.
A retest of previous resistance is not required to touch or come within several ticks of the old high; however, the further the top of the handle is away from the highs, the more significant the breakout needs to be.
KEY TAKEAWAYS
A cup and handle is a technical chart pattern that resembles a cup and handle where the cup is in the shape of a "u" and the handle has a slight downward drift.
A cup and handle is considered a bullish signal extending an uptrend, and is used to spot opportunities to go long.
Technical traders using this indicator should place a stop buy order slightly above the upper trendline of the handle part of the pattern.
Thanks for attention🙏
If you liked my chart, don't forget to click LIKE, it's not difficult for You, but I'm pleased ♥ ️
Also subscribe for not get lost😉
Always sincere with You♥️
Your Rocket Bomb🚀💣
CRVBTC trade ideas


CRVBTC - Long - Potential 15.43%CRVBTC - Long - Potential 15.43%
Exchanges: Binance
Signal Type: Regular (Long)
Entry Zone:
0.0000537 - 0.0000555
Take-Profit Targets:
1) 0.0000591
2) 0.0000640
Stop Targets:
1) 0.0000510
Trailing Configuration:
Entry: Percentage (0.0%)

CRV Macro Wave CountOne scenario to test weekly supply in Fall 2021. Just when BTC is due to go parabolic according to the S2FX Model, it would be logical to see alts, such as CRV, go parabolic as well.

Start of Uptrend for CRVI have radically changed my trading since I had a few heavy losses trading futures.
My new trading strategy will focus ONLY ON INCREASING MY BTC VALUE, not on USD but I will continue watching BTCUSDT
I'm using just a few indicators and mostly looking at Price Action
My strategy will work with
1 Volume Indicator (OBV)
1 Indicator that uses volume but it's a moving average (VWAP)
1 Momentum indicator (Hulli)
And the 180 EMA as reference.
I'm planning on keeping things simple, go long at the start of a new uptrend (shown by the Hulli turning green) with higher volume in the OBV giving more strength to this.


CURVE INVERSE HEAD AND SHOULDERSCurve is building inverse Head&Shoulder pattern here. It is struggling with neckling which is overlapped with EMA200. breaking this line is a strong buy signal and start of a price pump. MFI seems fine also and more volume required to here confirm break of the neckline.
Entry: 620-650
Target:
1) 750
2) 850
3) 900
4) 1050
5) 1150
6) 1500
7) 1700
8) 2100

Crypto|CRV/BTC|LongLong CRV/BTC
Activation of the transaction only when the blue zone is fixed/broken.
The author recommends the use of anchoring fixed the blue zone, this variation is less risky.
If there is increased volatility in the market and the price is held for more than 2-3 minutes behind the activation zone after the breakdown, then the activation of the idea occurs at the prices behind the activation zone.
The idea is to work out the resistance level .
* Possible closing of a trade before reaching the take/stop zone. The author can close the deal for subjective reasons, this does not completely cancel the idea and is not a call to the same action, you can continue working out the idea according to your data, but without the support of the author.
+ Maybe right now we will go even lower, then it's okay, the idea is not activated and simply canceled.
+ ! - zone highlighted by the ellipse is a zone of increased resistance, in this area there is a possible reversal for a correction, please take this factor into account in this transaction.
The "forecast" tool is used for more noticeable display of % (for the place of the usual % scale) of the price change, I do not put the date and time of the transaction, only %.
Blue zones - activation zones.
Green zones - take zones.
Red zone - stop zone.
Working out the stop when the price returns to the level after activation + fixing in the red zone.
Orange arrow - the direction of take.
The red arrow - the direction of the stop.
SUM PNL: This parameter displays the total % of all closed ideas of the "new" format (according to the author) for this sector at the time of publication of the idea. The calculation is very "clumsy" just the sum of the profits of all the ideas, based on this indicator, you can more accurately assess the risks when working with my ideas of this sector. I present you the construction of the idea, you can use it yourself as you like based on your subjective view and risks, the calculation of the PNL indicator is carried out only on transactions that the author closed on TV in manual mode or by take.
P.S Please use RM (risk management) and MM (money management) if you decide to use my ideas, there will always be unprofitable ideas, this will definitely happen, the goal of the system is that there will be more profitable ideas at a distance.


$CRV, Willing to give this one a new try...$CRV
Willing to give this one a new try...
Showing a two days on strong volume w/ UCTS 1D Buy signal..
Pushing toward ~6500 sats level (12H already retesting it on a potential R/S Flip)
Let see how it goes..
#CRV

CRV/BTCCRV has been so laggy behind other defi coins. Its price on BTC pair has been also sitting on the major support on the daily. With DEFI coins pumping across the board, its time to buy this one.
Note: If you like the content and the setup, please give me a follow not to miss out on many altcoins charts to come.


CRV Long TradeBuilding a position in CRV here. Expecting a new wave up soon in coming days. Bags Packed.

CRVBTC Time To Fly Spot Signal On " CRVBTC"
Order : Long - BUY
Price : 0.0000540 - 0.0000530
Targets : 0.0000600 - 0.0000700
Risk : 10%
Time Rate : 2 - 5 Days
ll Reasons ll
♣ Head And Shoulders
♣ Trend Line Break Out
♣ Support Area


$CRV, Crossed & now flipping ~5200 sats into support$CRV
Crossed & now flipping ~5200 sats into support
UCTS printed a 1D Buy signal a few days ago & now I'm looking for volume as signal of continuation..
Due to overall market behavior feel confident on how it can perform..
If starts catching up, then looking at ~7k sats
#CRV
CRV/BTC Long CRV/BTC is quite undervalued for what it offers.
It is the exchange token for the Curve.finance DEX and
offers the right to vote on exchange wide decisions.
Price is heading toward the diagonal resistance
initially formed in early last September with a diagonal
support line coming up after the bottom formed
in early January and a higher low was printed mid March,
contracting the price priming it for upwards expansion.
Madrid Ribbon flipped green (not pictured, would make chart messy)
The Ichimoku printed signs of a bullish reversal:
-TK cross occurred last week,
-Price has moved above the TK
-Lagging span has moved above price.
However Ichimoku is still not convincingly bullish yet:
-Kumo cloud is red
-Price is within the cloud
-Lagging span is below the cloud
-TK is below the cloud
Once a bullish Kumo twist occurs, the price moves
above the cloud, the TK moves above the cloud, and
lagging span moves above the cloud we can feel
strongly that a move to the upside could be coming.
A more risky but potentially more rewarding play is to
enter a position before the Ichimoku becomes fully
bullish at an S/R flip of the gray diagonal resistance,
with confluence that the cloud too has been flipped
to act as support around
.0000640
Mid term targets sit at the black horizontals at
.0001519
and
.0002204

CRV - Too late to buy? 🤔🤔CRV too late to buy? Not at all. It is just Starting. CRV has just broken out on BTC pair on 1D time frame. Just need some patience and you can still make 6X+++ from this one. One can buy it now in parts or wait for breaking out 3.60$ resistance in USDT pair. Anyways CRV is bullish both on USDT and BTC pair in mid term.
Not financial advice. DYOR.
A follow and like is always appreciated.
Thanks❤️


Curve your enthusiasmNote: I use multiple indicators just to confirm trend on different systems.
This one is similar to the swerve chart I posted today.
This is what the chart is indicating:
1. 2 out of 4 on Bullish setup on ichimoku system: bullish T-K cross (+1) , price almost above cloud (0), cloud just turned bullish (+1), lagging span close to above price .
2. Bullish 50-100 MA cross: long signal.
3. Currently price sits at a strong VPVR support which happens to be between the 0.236 fib level.
4. Strong VPVR support at 3000 sats
Forecasts:
1. CRV consolidated from end of December 2020 to mid-jan 2021. Price may consolidate again in the 3500-4500 range (scale in according to your risk appetite). Price has been in this range for about a month now so I feel there is healthy support in this region.
2. Some resistance at the 0.618 fib level at around 7200 sats. This level shows some VPVR activity so will need some good volume to break above this level.
3. Ultimate target should be the 1.618 fib level at about 13000 sats IF price breaks above 7200 sats.
Idea negated if price breaks below 345 sats.
