CRVBTC trade ideas

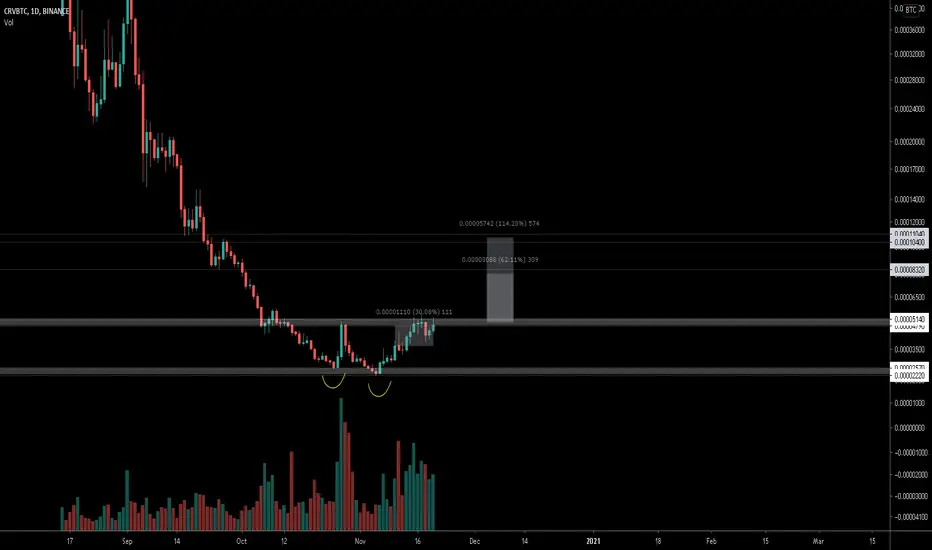
Decisive Breakout | Altcoins Will Indeed Grow On This DropThe question always is, "Will the altcoins grow this time around when Bitcoin drops?"
Curve (CRVBTC) provides the answer.
Today Bitcoin becomes shaky and look at the CRVBTC chart... We have a very strong and decisive bullish breakout with prices moving above EMA50 today.
We also have really high volume and very strong RSI...
Many, many more of the Altcoins vs Bitcoin (ALTSBTC) pairs are looking the same.
The altcoins will grow as Bitcoin prints its retrace... This is also a bullish signal for Bitcoin.
Namaste.


CVRBTC - Long - Potential 18.25%CVRBTC - Long - Potential 18.25%
Entry- 226
TP1- 243
TP2- 266
SL- 207
- BTC Break Volatility Likely - Manage Trades
- RR - 2.32
- Trailing Buy - 0.5%
- Trailing Profit - 1%
- Trailing Stop-Loss - No

is it possible to forming head and shoulder pattern on CRV/BTCI am really curious to see what happen next. It is really similar to head and shoulders pattern at this point. it is just an idea right not a plan for trading.

Is this be the bottom of crv before it belast us to a 19x?€
Greetings!
So lets talk about CRVBTC a verry interesting one i gues!
It came on the market in the begin at the price of 49.95 euro.
Afther that it had a terrible downtrend back to the price of 0.2737
afther that it had a litte uptrend the downtrend started again that period lasted until the WMA and SMMA hit again for the seccond time
as that repeats his self until the 4th time when the WMA and SMMA hits again in his downtrend we can see the first green candle on the 4hr chart.
i think it found a new bottom on the price we where these days.
Its going for MARS on the long run
I like buying bottoms so i guess this is a good entry?
Let me know in the comments what you think about this !


CRV round bottom with iSHS could bring a x10Here I share you this idea
It seems extreme, because it is.
Enter slowly and wait some weeks, we will have results.
All the information is in the chart.
Cheers!

crvbtc looks good to me... hid bull dive 4H, top of the bb, abve ema, macd push as it breaks resistance, good vol, HVP setting up for a move would expect it to follows trend...,,,what not to like .. 4H cls abve 411sats could be a nice long...scale in a position is my advice cls position if either 4H cls belw 376 sats or stop loss hit ... set SL belw 332sats

Curve DAO Token (CRV) vs BTC / USD - Hidden Bullish DivergenceFollowing a 95% correction and oversold condition (orange columns) on the above 1-day chart we now have an incredible buy opportunity.
Some facts of the chart:
1) Regular Bullish divergence (blue line) between price action and money flow index.
2) Point (1) together with following increasing volume - bullish.
3) Hidden Bullish divergence (orange line) - this occurs with higher highs in price action together with lower lows in Stochastic RSI - very bullish.
4) Dragonfly DOJI on hidden divergence.
5) Higher lows on supporting trend line.
The 2-day dollar chart - Dragonfly DOJI


$CRV, Forming a potential double bottom $CRV
Forming a potential double bottom pattern as its trying to break from current range at ~5k sats..
If manages to breakout, then upside is quite massive..
Still early to say but that UCTS Buy signal on the daily is tempting...
#CRV
CRV daily trend analysisThis analysis is a little optimistic but has the potential to happen on CRV as it has dropped a lot through the last weeks in pair with bitcoin. If it can take back its value against bitcoin in the upcoming alt-season this is what I'm looking for

CRVBTC - Long - Potential 18.66%CRVBTC - Long - Potential 18.66%
Entry- 459
TP1- 487
TP2- 544
SL- 417
- WARNING - Higher risk trading conditions - short-term bearish BTC signs that could draw market down
- RR - 2.07
- Trailing Buy - 0.5%
- Trailing Profit - 1%
- Trailing Stop-Loss - No

Curve (CRV) Strong Consolidation, Volume Increases (Over 800%)Curve (CRVBTC) is now showing what we call "strong/bullish consolidation"... We get consecutive green candles as prices move up.
We have really strong indicators with increasing volume.
This is all signaling what we are seeing from other altcoins and trading pairs.
CRVBTC is ready to jump... Additional details on the chart.
Namaste.

CRV/BTCLike so many DeFi altcoins that earlier this year, CRV is looking extremely bullish since the bounce. I DCA'd on the way down when I saw bullish divergences forming on the daily and bought a big position at 220-240 sats. Currently letting this ride as I have a bad habit of selling too early.
I'm getting accumulation cylinder vibes. twitter.com
If this is an accumulation cylinder, my target is at the top of a parallel channel I drew (can't see it on this chart), but the top of the channel is 1030-1150 sats. This is also a major horizontal resistance point. Currently trading within a low time frame ascending wedge, which is generally bearish and breaks down, but this would break down to point 7 of the accumulation cylinder. If that's accurate, then load up at ~ 430 sats.
Good luck to all. Tokenomics on CRV sorta blow, with an inflation rate of 2 million CRV tokens per day, that being said, this chart is sexy.

CRV Possibility 100% to 400% JUMP - CURVE CRVBTC CRVUSDT CRVUSDCRV Possibility 100% to 400% JUMP - CURVE CRVBTC CRVUSDT CRVUSD
