CRV price - "Inverted Head and Shoulders" pattern on a chart ?Today we will analyze the price movement of CRVUSDT on the global chart.
It can be assumed that the global "Inverted Head and Shoulders reversal pattern" has been forming on the CRVUSD chart for the past year. At least, the price structure and the falling trade volumes from the left to the right shoulder correspond to those described in the Encyclopedia of Trading Patterns.
A surge in trading volumes should occur after the price of CRV tries to break through, and hopefully breaks through and consolidates above the $1.18 level . As you can see from the trading history, there was a lot of struggle between buyers and sellers around this level.
But before that, buyers need to break through and gain a foothold above the local level of $0.80-0.82. Buyers have a lot of work to do to revive speculators' interest in the CRV
Well, after the CRVUSDT price is firmly established above $1.18 , the Inverted Head and Shoulders pattern will finally activate. At the same time, the long-term target for the growth of the CRV price, which is in the range of $3.50-4.50 , will be activated, and we were remembering the average - $4 per Curve DAO token.
_____________________
Did you like our analysis? Leave a comment, like, and follow to get more
CRVUSDT trade ideas


CRV/USDTDaily looks promising might see a reaction above 0.700-0.7200, hold above can give a 10-12% easy move

CRVUSDT 21 June Next MovePair : Crypto ( CRVUSDT )
Description :
Bullish Channel as an Corrective Pattern in Long Time Frame and Rejection from the Lower Trend Line
Divergence - RSI
CHoCH - SMC
Impulse Correction
Completed " 1234 " Impulsive Wave
Symmetrical Triangle
Consolidation Phase


CRV DAO LONG 20230620Bottom structure, not very solid, while if it can follow Bitcoin's bull trend.
CRV DAO, CRVUSD , CRVUSDT , CRVUSDT.P , BITCOIN , CRYPTO, CRYPTOCURRENCY
DISCLAIMER
This is only a personal opinion and does NOT serve as investing NOR trading advice.
Please make your own decisions and be responsible for your own investing and trading Activities.

TRADE OF THE DAY | CRV looking like a breakdown incomingTRADE OF THE DAY | CRV looking like a breakdown incoming
A significant bearish divergence and a break of the trendline on the RVOI whilst trading below retesting the 50EMA is setting up for a continued break down. There is also news of a risky loan in AAVE and the resulting liquidation threat for CRV have pushed the governance token to a 1-year low.

Piyasa Güncellemesi CRV Analiz Piyasa Güncellemesi CRV Analiz 10.06.2023 Gece Operasyonu sonrası Alım denemeleri - Dip yakalama çalışması

CRVUSDT Next Possible MovePair : Crypto ( CRVUSDT )
Description :
Bullish Channel in Long Time Frame as an Corrective Pattern with the Breakout of the Lower Trend Line
S / R Level
RSI - Divergence
Break of Structure
Consolidation
" ABC " Corrective Wave
Impulse Correction

CRV IS BEARISHHi, dear traders. how are you ? Today we have a viewpoint to SELL/SHORT the CRV symbol.
For risk management, please don't forget stop loss and capital management
When we reach the first target, save some profit and then change the stop to entry
Comment if you have any questions
Thank You

CRVUSD ❕ downward channelRSI chart moves in bearish zone (4H, 1H and 30m TFs)
The asset has fixed under 200EMA on the 1H Timeframe.
I believe that the price will continue to decline.

CRVUSDT → The price is squeezed between the strong linesCRVUSDT forms the bottom in the area of 0.500-0.600. After that, a rally is formed, which turns into a strong consolidation in the area of trend resistance.
The cryptocurrency pair after another retest forms a resistance breakout, but at the same time, the price is still on the upper boundary of the local pattern.
In the near future, if the price successfully overcomes the area of 0.883, I expect an active strengthening of the price to the area of 1.112 with the subsequent movement to 1.891.
CRV shows great dynamics on the background of the fact that after the rally, there was not a strong pullback, but a consolidation is forming.
The price got a strong support at 0.818 and from the MA-200.
MA50 is a resistance and the price might try to test it soon.
Strong support at 0.818 and 0.770
Strong resistance: 0.883, 0.980, 1.300
I expect consolidation between 0.850 and 0.950 with further break through the resistance of the local wedge and growth to 1.890.
Regards R.Linda!

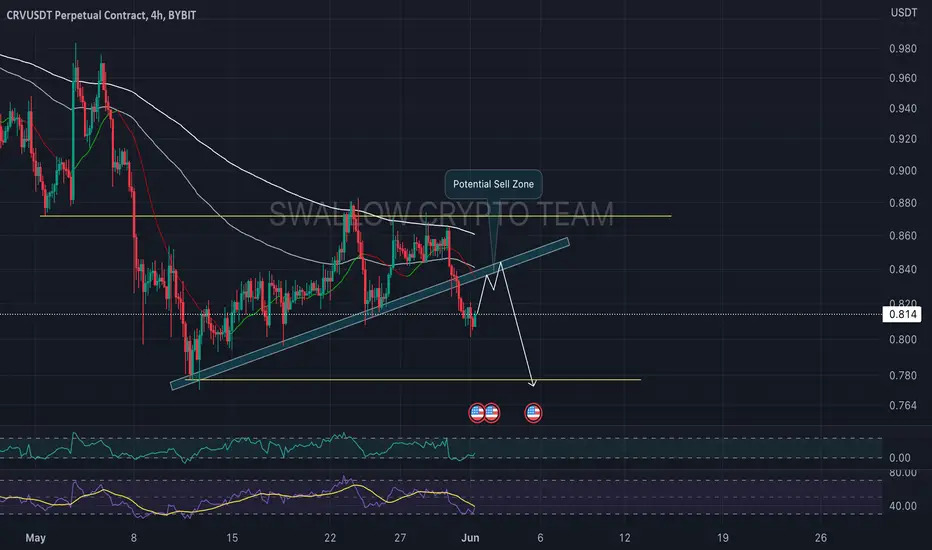
CRO/USDT with potential re-testHey traders 👋
CRO/USDT is another pair that caught our attention here. We see how on 4-hr chart we had a nice breakdown from a rend after what we see a good potential for a small correction to re-test that same trend there. We are waiting for that zone there and once we are at the re-test we will most likely look again for an entry here!
If you like ideas provided by our team you can show us your support by liking and commenting.
Yours Sincerely,
Swallow Team
Disclamer:
We are not financial advisors. The content that we share on this website are for educational purposes and are our own personal opinions.
CRV good to betI firmly believe CRV is behaving in good technical shape and if BTC does not surprise us, CRV can complete its trend reversal. Interestingly, it has good notable R/R ratio.

Potential Breakthrough Ahead with RSI MomentumThe CRV (Curve DAO Token) has recently rebounded from the established daily support range of $0.756 - $0.79. With the local resistance zone located between $0.92 - $0.93, there is a possibility of a price movement towards this area. It is recommended to exercise patience and await a test of the support zone before considering new entry positions. Additionally, the Relative Strength Index (RSI) level currently stands at 58, indicating moderate strength and momentum in the CRV's price. This suggests a balanced market sentiment with potential for further upward movement. However, it is important to closely monitor price action and consider other relevant factors before making any trading decisions.


CRV longCRV bounced off the ascending trendline and bounced off the support level. Bullish movement to resistance level at 0.88 is expected to happen.

CRV is going to PUMP and I like itCrv holding support on the 2hr chart, taking profit at the resistance levels. 0.91 should satisfy me
Find order and Chaos will follow.


#CRVUSDT #LQR #TOBTC #LaqiraProtocolMinor Scalpe support Level (0.810 - 0.820) and minor resistance Level (0.850 - 0.860).
You can open a trade after confirmation.
If Break resistance
the important resistance Level (0.890 - 0.910) will sell well after the confirmed.


CRV, give it to me straight!If you find this info inspiring/helpful, please consider a boost and follow! Any questions or comments, please leave a comment! Also, check out the links in my signature to get to know me better!
At an important level here, watching for how PA prints from here.
If it bounces, could be some kind of running or expanding correction coming in.
I am anchoring the count based off of an impulse down, due to sharpness, so looking for an impulse to complete the ZZ. It may be some kind of 2xZZ as well, but I have some long entries planned as well if that is the case.
Cheers!
