CRVUSDT likely to hit weekly support and bounceThis one is also aiming for weekly support WS1. 0.80-0.81. It has come quite close to it and I believe it wont shy away from it. However, that hit of the price to the weekly support may provide a long opportunity. The target for this long should be 0.854 and if extended 0.883.
CRVUSDT trade ideas

CRVUSDTHow do you do dear followers,
*Mars Signals Team wishes you high profits*
This is a one-day-time frame analysis for CRVUSDT
Here we have R3 and R2 which are our resistance areas in this chart with their demonstration of the disability of the price to rise at various points. R1 is a 4-hour resistance area. And as you observe, S1 is a long-term support area at the bottom that involves the well support of price at some different points even since the past. Clearly, the price experienced a great support at S1 area and via a notable rise, it could move up to the third resistance area. But after losing the support and being rejected there, we observed its decline down to S1 again. By having the last touch and support here, the price rose for another time to higher amounts and failed to move over R1 area. Therefore, it is fluctuating below our first resistance via a positive Marubozu Candle and we expect it to provide us two scenarios after being supported here and moving over R1 area. One of them would be receiving some confirmation candles for the purpose of a rise and then by being supported and breaking R1 line upward and via providing more fixation and fluctuation over there, more rise will happen in order to touch higher amounts including R2 and R3 (which are good points for saving your profits). But when the price falls down to S1 and loses the support at its current point or at any higher points in its rising trend, surely more decline will happen then. According to the chart and considering the signs here, when the price is fluctuating above S1, we won’t have so much decline. Please consider the market situation in lower time frames and then decide what to do exactly. We suggest you to save your profits in the resistance areas due to the fact that in the decline of the price, you will not have so much loss. Keep moving with our updates and analyses to have multiple pieces of information and ideas.
Warning: This is just a suggestion and we do not guarantee profits. We advise you to analyze the chart before opening any positions.
Have a great time

CRV SHORTWe may see a bullish bounce to a low order block and then a continuation of the downtrend as Bitcoin should fall, you could see a fall to a fairly bullish order block.

CRV/USDT LONG 🟢CRV/USDT LONG 🟢
Leavareage 10X
Entry Price - 0.94$
Take Profit- 1$
Stop Loss- 0.916$
Stop Loss Important
@msrcrypto

CRVUSDT (1H) - Hi Traders
CRVUSDT (1H Timeframe)
The market is in a downtrend, and we are waiting for an entry signal to go SHORT below the 0.931 support level. Only the upward break of 0.979 would cancel the bearish scenario.
Trade details
Entry: 0.931
Stop loss: 0.979
Take profit 1: 0.901
Take profit 2: 0.853
Score: 7
Strategy: Bearish breakout

CRVUSDTFIb shows very good in a lower time frame expecting a bounce above 2$, so mark your entries and maintain risk management

an update on CRV's Bullish trendPrice finally managed to break the Pennant .the price can easily reach the target(2.2) .
Previous Analysis
_ _ _ _ _ _ _ _ _ _ _ _ _ _ _ _ _ _ _ _ _ _ _ _ _ _ _ _ _ _ _ _ _
🌍Thank you for seeing idea .
Have a nice day and Good luck.

CRV: Resistance BreakoutTrade setup : Price reached $1.25 resistance and pulled back to 200-day moving average, which could be an attractive swing entry in Uptrend with upside potential back to $1.25. It just broke back above $1.00 resistance level, indicating Uptrend continuation. Note that price made a Higher Low during this recent downswing, which is also a sign of Uptrend.
Trend : Uptrend across all time horizons (Short- Medium- and Long-Term).
Momentum is Bullish ( MACD Line is above MACD Signal Line and RSI is above 55).
Support and Resistance : Nearest Support Zone is $0.75, then $0.50. The nearest Resistance Zone is $1.00, which it broke, then $1.25.

CRVUSDT (4H) - Bullish breakoutHi Traders
CRVUSDT (4H Timeframe)
The market is in an uptrend, and we are waiting for an entry signal to go LONG above the 1.048 resistance level. Only the downward break of 0.986 would cancel the bullish scenario.
Trade details
Entry: 1.048
Stop loss: 0.986
Take profit 1: 1.085
Take profit 2: 1.145
Score: 7
Strategy: Bullish breakout

CRV can Rise from hereWe have a bullish pennant on daily,The Break out has not Happened yet .Bullish case if we do break out pennant.
_ _ _ _ _ _ _ _ _ _ _ _ _ _ _ _ _ _ _ _ _ _ _ _ _ _ _ _ _ _ _ _ _
🌍Thank you for seeing idea .
Have a nice day and Good luck

CRV, see you at the high peak soon...CRV weekly chart is conveying a definite ascending price movement -- creating higher lows.
a x10 prospect -- and thats conversavitve (long term goal)
Significant Accumulation and net buying is spotted at the current levels.
SEEDED AT 1.0
TAYOR.

CRV, Are you Ready!?I've had my eye on CRV for a few weeks now,
and think this coin is poised for some serious growth! With its price inching closer to a key resistance level, the market sentiment is looking bullish, and I believe this could be a great opportunity to get in on the action. This project has enormous potential, . Get ready for the ride. Trade safe. Don't get rekt

✅TS ❕ CRVUSD: reached the resistance area✅✅ CRV/USDT reached the resistance area.
The chart instantly reacts to resistance.
Price will turn around for a decline. ✅
🚀 SELL scenario: short to 0.925 🚀
----------------------------------------------------------------------------
Remember, there is no place for luck in trading - only strategy!
Thanks for the likes and comments.

CRV/USDT - Bearish Reversal Pattern - HarmonicsCRV/USDT is forming a harmonic bearish reversal pattern. Expecting price to move up towards PRZ and break bullish trend to start bearish trend!

CRV with the setup to flyCRV with high volume, momentum, and perfect structure above all moving avg's on the daily. What else needs to be said?


CRV Analysis, 1D Time Frame Hi Tradingview community, wish you all a good sunday:
I'm back with new analysis, today i look for CRV.
Bias : Bullish
TF (Analysed) : 1D, 4H. 15m and 5m.
I opened a position with the same setup as yuo can see in chart.
I believe in a new retest from 1.00 level, should be a bullish confirmation if we will stay above this level.
As you can see we got multiple supports levels, Trendline, Fibonacci, Demand area.
The supply area 0.950, was reached 2 days ago, that's why i opened a position.
I have waited till a drop from this zone and now i think is at good entry point.
Do your own research. #DYOR
It's not a financial advise, i share my personal trades setups.
Comment below if you want to quest something.

CRVUSDTCRVUSDT LONG
Entry : 0.939 / 0.944
Leverage : Cross X20
Capital invested : 2%
Targets : 0.95344 0.96288

CRVUSDT hit daily resistance, likely to head downThe price hit the daily resistance zone DR and currently trading inside this resistance zone. The probability favors a short here and the target should be the daily support zone DS.

CRVUSDTWe have a bunch of ranges here. Global 0.53-1.6, and few locals: previous 0.53-0.744 and current 0.86-1.06. I expect it could be a manipulation with 0.86 level and under it there is our first support zone at around 0.82. The next support at the high of previous range at 0.74-0.76 and the large one at 0.65-0.7 and the last at 0.58.

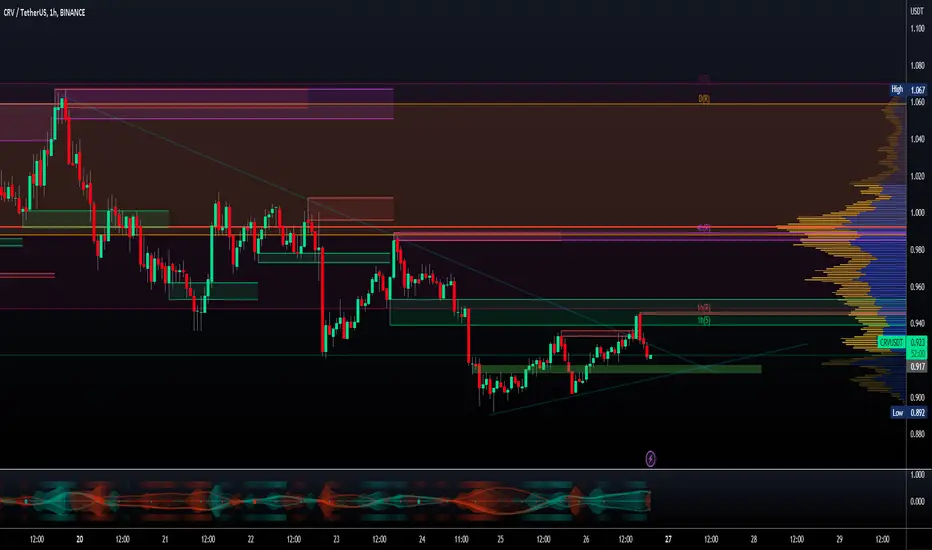
CRV/USDT - Curve: Resistance_Breakout◳◱ A Resistance Breakout has been identified on the $CRV / $USDT chart. The price has broken above a key resistance level, indicating a potential bullish trend. The next resistance key levels are located at 1.103 | 1.187 | 1.392, and the major support zones can be found at 0.898 | 0.777 | 0.572. Consider entering at the current price zone of 0.923 and targeting higher levels.
◰◲ General info :
▣ Name: Curve
▣ Rank: 61
▣ Exchanges: Binance, Kucoin, Bybit, Huobipro, Gateio, Poloniex
▣ Category/Sector: Financial - Decentralized Exchanges
▣ Overview: Curve Finance is a decentralized exchange optimized for low slippage swaps between stablecoins or similar assets that peg to the same value (e.g. wBTC/renBTC). The protocol employs a Automated Market Maker that was built specifically to give DeFi users low slippage and liquidity providers steady fee revenue.
◰◲ Technical Metrics :
▣ Mrkt Price: 0.923 ₮
▣ 24HVol: 5,480,605.876 ₮
▣ 24H Chng: -0.859%
▣ 7-Days Chng: -9.50%
▣ 1-Month Chng: -7.32%
▣ 3-Months Chng: 72.61%
◲◰ Pivot Points - Levels :
◥ Resistance: 1.103 | 1.187 | 1.392
◢ Support: 0.898 | 0.777 | 0.572
◱◳ Indicators recommendation :
▣ Oscillators: NEUTRAL
▣ Moving Averages: STRONG_SELL
◰◲ Technical Indicators Summary : SELL
◲◰ Sharpe Ratios :
▣ Last 30D: -1.81
▣ Last 90D: 2.63
▣ Last 1-Y: -0.09
▣ Last 3-Y: 0.23
◲◰ Volatility :
▣ Last 30D: 0.96
▣ Last 90D: 1.05
▣ Last 1-Y: 1.31
▣ Last 3-Y: 1.85
◳◰ Market Sentiment Index :
▣ News sentiment score is N/A
▣ Twitter sentiment score is 0.49 - Bearish
▣ Reddit sentiment score is 0.71 - Bullish
▣ In-depth CRVUSDT technical analysis on Tradingview TA page
▣ What do you think of this analysis? Share your insights and let's discuss in the comments below. Your like, follow and support would be greatly appreciated!
◲ Disclaimer
Please note that the information and publications provided are for informational purposes only and should not be construed as financial, investment, trading, or any other type of advice or recommendation. We encourage you to conduct your own research and consult with a qualified professional before making any financial decisions. The use of the information provided is solely at your own risk.
▣ Welcome to the home of charting big: TradingView
Benefit from a ton of financial analysis features, instruments and data. Have a look around, and if you do choose to go with an upgraded plan, you'll get up to $30.
Discover it here - affiliate link -
#crv #Crypto # #signal4 hours time frame to identify divergence in RSI.
15 min time frame to identify break out of the FTR zone.

#CRVUSDT 4H Chart
After breaking below the previous low at $0.936, price gave us bearish confirmation from this 4h supply zone where it is currently getting rejected from. MACD is showing bearish weakness, RSI and EMAs are neutral. Price may liquidate the equal highs present above this 4h supply zone before moving down again but overall i am expecting price to keep moving down and liquidate this support line.
