CRVUSDTWe can attempt to short CRVUSDT from specified level if it break HL , also bearish divergence occur indicate that it moves downward.
SL , TP mention in chart.
CRVUST trade ideas

CRV/USDTLSE:CRV recently broke through a strong resistance, there's a possibility it continues to push further to a new range if new support hold firm.

#CRVUSDT In a Perfect Setup to Rally From the Support ZoneYello Paradisers, ready for a potential #CRV rally from the key support zone? Let's look at the latest analysis of #CRVUSDT and see what's happening:
💎 LSE:CRV is currently hinting at a bullish continuation from a critical support zone at $0.245. We’ve been watching #CurveDAOToken closely as it follows a falling wedge pattern, and now it's broken above the descending resistance line. Internal resistance at $0.408 is the next target for CRV.
💎If #CRVUSDT holds strong at this level, we could be on the verge of a significant bullish rally, echoing previous trends. A breakout above the key resistance at $0.408 might set the stage for a run toward the next resistance zones and beyond.
💎However, caution is essential. If the momentum falters at this critical support, we might witness a rebound from the lower support area around $0.18–$0.20.
💎Stay sharp and keep a close eye on #CRV price action. A daily close below the demand area could invalidate the bullish scenario and open the door to further declines.
Remember, the market rewards those who stay focused and follow their strategy.
MyCryptoParadise
iFeel the success🌴

CRV — Ready For A Free Fall? CRV is currently trying to stay above the neckline of a head and shoulders pattern on the 1H chart.
A break below the neckline will inevitably trigger downtrend momentum and send the price toward 0.25 (or lower).
Especially if the broader market turns red during the next hours, CRV will be in massive danger.
Therefore, watching the neckline and shorting once it breaks below is certainly an option. However, due to today's volatility, such a trade bears a higher risk level and should only be executed with a tight stop loss.

Curve $CRV 20x comebackcurve LSE:CRV could be a great comeback story from under 30 cents back to $6, but only if it can reclaim the range. A lot of sellers came in a the low and most probably handed over their coins to the defi whales.

Movement Towards Higher ResistancesCRV is currently within a range that could play a crucial role in determining the next price direction. This range is between $0.26 and $0.29 and could act as a balance area.
Potential Scenarios:
Downward Pullback:
If a downward pullback occurs, the price might reach the $0.26 to $0.29 range. This range is considered a significant support area that could prevent further price declines and lead to a price rebound.
Movement Towards Higher Resistances:
After stabilizing within the support range, the price might move towards targets of $0.34 and $0.37. These levels are considered important resistances, and breaking through them could signal a strengthening of the bullish trend.

CRV/USDT PLAN CRV/USDT is currently experiencing a breakout with significant volume. There is a high possibility of a bullish move of 40-80% in the short term. It is advisable to conduct your own research before considering any investment decisions.

CRV bullish moveCRV reclaimed its daily support and we will see the areas marked in chart to play out very soon

CRV potential Long- Price took out the all time low again
- No moving up and offering a potential Long Trade.
- If price does break structure to the upside, we have the confirmation to enter a long position as shown with the squiggle line.


Curve DAO Crv price will surprise all of us?)And the award for the most unpredictable coin goes to CRYPTOCAP:CRV !)
While the price of OKX:BTCUSDT is correcting and the vast majority of altcoins are following it, #CRV holders woke up after 2.5-3 years of hibernation and said: "Ooooh, now is the best time to buy OKX:CRVUSDT ".
Or how else to explain the 2-months of increased trading volumes in the #CRVUSDT pair and the fact that the price of the #CurveDAO token has been growing quite actively for the last 3 days, if such a phrase is legitimately used with CRV at all )))
‼️ The critical level for August-September for the #CRVUSD price is around $0.60
If they can gain a foothold above that, then maybe we will see CRYPTOCAP:CRV at $1.2 before the end of 2024 !)

CRVUSDT trading opportunity with Key Zones to Watch!We're currently witnessing intriguing dynamics in the CRVUSDT chart after the recent breakdown from a rising wedge pattern, bearish sentiment seems to be in play, but there are specific zones we should take note of.
CRVUSDT exhibited a classic breakdown from the rising wedge pattern. The base of the rising wedge is now our immediate focus. As we approach this zone, it could serve as a strong support level. For those with a bullish bias, this could be an area of interest for potential long entries.
However, a word of caution, if the price decisively breaks below this wedge support, it will flip roles and become a strong resistance.
In such a case, shorting the pullbacks towards this new-found resistance could offer lucrative opportunities, with targets pointing towards the Potential Bear Target as shown on the chart.
Moreover, on the flip side, higher on the chart lies a significant lateral resistance zone. This region has proven to be a thorn for the bulls previously. If at any time, the price manages to pierce through this zone with conviction, we might be in for a bullish reversal. Keep a hawk's eye on this!
With both bearish and bullish scenarios on the horizon, it's vital to be nimble and trade based on confirmed signals.
As with all trades, make sure to employ stringent risk management and await confirmations before making entry decisions.
Happy trading.

CRV/USDT ENTERING NEW HIGH VOLUME TRENDThe last data shows that CRV/USDT has a good chance to create a new volume in the coming time frames, we will follow up to see if this coin is able to have confirmation in the coming time frames.
CRV/USDT has a history of breakdown trends, we will follow the coin to see if this is the reversal trend. The last data shows a high chance of volume building for this coin.


Can CRV make 10x move?BINANCE:CRVUSDT kept making lower lows but doesn't mean it is not gonna go down more. In my opinion BINANCE:CRVUSDT trading in bullflag pattern which is a sign of reversal and checked bottom line 3 times which we can consider as triple bottom. 0.48-0.52 area is crucial which can decide either go up or make another low, but most importantly BINANCE:CRVUSDT must break upper trend line in order to make 10x move. Also MACD making huge Divergence in 1W TF and great amount of Volume coming in lately. I will be taking profits at those green lines.

CRV longBreak trendline (dotted red) and reclaim midrange (dotted grey) and I think we see range high


CRV NEW INCREASE VOLUMECRV's low time frame shows a high possibility for a new trend increase which could be confirmed in the coming time frames.
We will follow up on this coin to see if it's able to be confirmed.

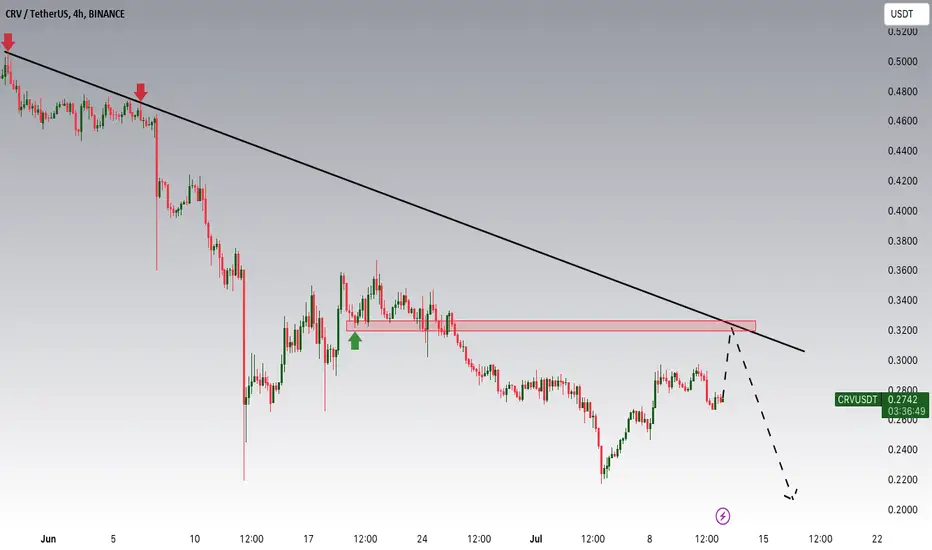
CRVUSDT Is Approaching The TrendHey Traders, in today's trading session we are monitoring CRVUSDT for a selling opportunity around 0.31 zone, CRVUSDT is trading in a downtrend and currently is in a correction phase in which it is approaching the trend at 0.31 support and resistance area.
Trade safe, Joe.
CRVUSDT Is Approaching The Down TrendHey Traders, in today's trading session we are monitoring CRVUSFT for a selling opportunity around 0.2970 zone, CRVUST is trading in a downtrend and currently is in a correction phase in which it is approaching the trend at 0.2970 support and resistance area.
Trade safe, Joe.

CrvCurve dao
One of the most useful altcoin projects on eth and its a mystery to me that it could become this undervalued
I guess the luna fiasco with stablecoin depegging still hasnt returned faith in this products use if other stable coins were also to fail, nonetheless its one of the most simple useful mechanisms in the space..
Think we reclaim the 40c range eventually and this zone is the Elliot deviation but we shall see..

CRV analysis: Looks bullish for mid-termLSE:CRV has been consolidating within a triangle pattern for almost four years, and it is now on the verge of breaking out either above or below this pattern. It is most likely to be a bullish breakout, potentially moving upward toward three main targets specified on the chart: $0.90, $1.65, and $4.48 over the next few months.
