CRVUSDT 🟢🚀 Premium Crypto Signal Alert! 📈
🔔 Signal: BUY
Asset: CRVUSDT
Technical Analysis:
Moving Average Signal: The CRVUSDT pair has generated a strong buy signal as it closed above the 200-day moving average, indicating a robust bullish trend.
Support Level: The price has demonstrated remarkable strength by consistently staying above 0.60 for an extended period, establishing a solid support point.
📊 Trade Details:
Entry Point: Current market level
Target 1: 0.85
Target 2: 1.10
Target 3: 1.25
📈 Trade Analysis:
The 200-day moving average crossover signals a potential upward momentum.
Sustained trading above 0.60 showcases a substantial support level, enhancing the overall bullish outlook.
Targets of 0.85, 1.10, 1.25 present lucrative profit potential.
💡 Risk Management:
- Only use 10% of your capital for this trade to mitigate risks.
- Do not invest your full capital; it's important to diversify and manage risk exposure.
- Consider setting a stop-loss at an appropriate level to protect your investment.
- Regularly monitor the trade and adjust stop-loss levels as needed.
🔄 Additional Buy Zone:
- Be prepared to identify and utilize another buy zone if market conditions require it. Flexibility is key in adapting to changing trends.
📢 Spot Trading vs. Futures:
- Spot trading is a safer and more controlled approach, allowing for better risk management compared to the higher volatility and speculative nature of futures trading.
- Exercise caution and consider the potential risks associated with leveraged instruments.
🚨 Disclaimer:
Trading involves risks, and past performance does not guarantee future results. Exercise caution and conduct your research before making any financial decisions.
CRVUST trade ideas

CrvusdtBreak that resistance and 100% incoming for 2024
That'll be the start of the move..
Much higher eventually :)

CRV/USDT Accumulation PhaseBelow is the description of the accumulation phase potential development of the CRV/USDT cryptocurrency pair.
After reaching a local minimum in November 2022, when CRV was trading around $0.3982, there was a convincing upward movement that led to a significant increase to $1.29. During this period, the asset demonstrated a growth of more than 225%. Subsequently, the asset gradually declined, reaching a new local minimum at $0.3882.
During the price decrease, a descending trading channel was formed. At the moment, the asset is testing the upper boundary of this channel, which is occurring at the level of $0.6382.
Considering the current trends, we can assume that the asset is preparing to overcome the upper boundary of the trading channel. This could happen after a small corrective pullback to the average price within the descending channel.
Following a successful breakout above the upper boundary of the channel and a subsequent retest with a possible bounce from it, a positive signal for further growth of the asset can be expected. This scenario could indicate movement towards a price maximum at the level of $1.29.


CRVUSDT SHORT CRVUSDT SHORT
Entry : 0.6645 / 0.6569
Leverage : Cross X20
Capital invested : 2%
Targets : 0.650331 0.6437620000000001


CRV: Channel UpTrade setup : Price is trading in a Channel Up pattern. Swing traders: can enter near Channel support trendline (~$0.60) and exit near Channel resistance trendline (~$0.75). Stop Loss (SL) at $0.50. Previously, price broke above 200-day moving average to confirm a bullish trend reversal to an Uptrend. Curve (CRV) is a well-established DEX used primarily for swapping of stablecoins.
Pattern : Price is trading in a Channel Up pattern. With emerging patterns, traders who believe the price is likely to remain within its channel can initiate trades when the price fluctuates within its channel trendlines. With complete patterns (i.e. a breakout) – initiate a trade when the price breaks through the channel’s trendlines, either on the upper or lower side. When this happens, the price can move rapidly in the direction of that breakout.
Trend : Uptrend across all time horizons (Short- Medium- and Long-Term).
Momentum is Mixed as MACD Line is below MACD Signal Line (Bearish) but RSI ~ 50 (Neutral). MACD Histogram bars are rising, which suggests that momentum could be nearing another upswing.
Support and Resistance : Nearest Support Zone is $0.55 (previous resistance), then $0.40. The nearest Resistance Zone is $0.75, then $0.90.

CRV - Still Perfect
Above is my last post on CRV. Recently we saw price fall to our trendline to test it as new support. It held perfectly and has been rapidly increasing in price. We could still see a big move ahead for CRV.

CRVUSDT - BULLISH OUTLOOKBreak to the upside on the trendline, bull scenario looks promising here.
Targeting the highs

CRV/USDT Buy Opportunity!!BINANCE:CRVUSDT.P The chart indicates a distinct try breakthrough of resistance for CRV. This presents an opportune moment to initiate a LONG trade.
#CRV/USDT LONG
Entries: $0.637
Take profit 1: $0.648
Take profit 2: $0.676
Take profit 3: $0.718
Stop Loss: $0.575
Stay tuned for trade confirmation and additional updates. Feel free to express your thoughts by liking and sharing in the comments section:)
Thanks
The sroced.

CRV: Answered Question Regarding Current Price ActionHi Everyone! A follower asked a question, "Hi David, are wwe in danger to see a third leg down here?" Their question was regarding CRV 6-hour time frame. They showed a descending channel in a 6h chart that looked something like the chart I'm showing below.
I went on to explain my reasoning behind this current move down being used by the Composite Groups for several purposes.
1 - Taking profit on longs opened between $0.40 cents and $0.50 cents. When taking profits on those longs, they also opened shorts because they knew they were going to sell quite a bit of their longs; causing the market to fall; hence the reason for opening a short.
2 - They also have "new" long position limit orders at a price range lower in which they will have completed taking profits on their $0.40 cent to $0.50 cent long orders and begin closing their shorts to take profits on those shorts within the range their new long position limit orders are in place. This could actually be seen as "wash trading." But I digress.
Anyway, I hope this video publication was helpful.
Happy Trading and Stay Awesome!
David

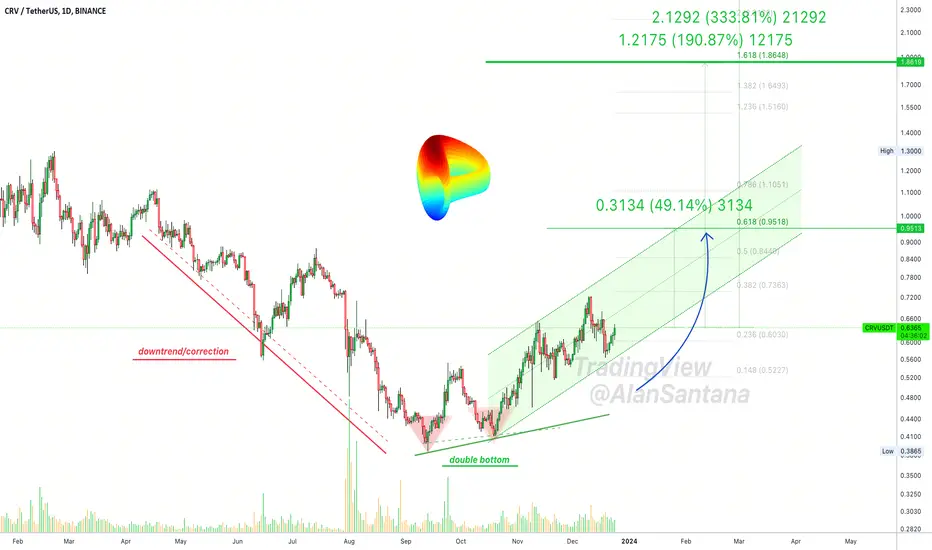
✴️ Curve 333% | Update On Final Target (Important All Altcoins) A quick update to all my dear readers, supporters and followers; This is related to the Altcoins in general.
We are using the March/April 2022 price level as the top for this current bullish wave, while this can be truth in some cases, this projection is already being broken. Many pairs, way too many, are moving past this resistance zone.
So please update your planning and allow for anything to happen.
Too many pairs will be going ultra-bullish now and we don't want to repeat the same mistake as in years past of being too conservative with the final target.
➖ As for Curve (CRVUSDT), we have a downtrend ending in a double bottom pattern.
➖ We have a classic reversal signal: High bear volume in August yet volume is lower in September when the lower low is hit.
This sequence led to a rising channel.
This channel can be broken to the upside; This means that the upper boundary of the channel is very likely to break (strong rise).
👉 The targets can be seen on the chart, up to 190%.
👉 Another major resistance point can be found at $2.77 (333%).
Thank you for reading.
Namaste.
$CRVabove the 200 ema
invalid with a close below it
hopped on now expect whtie line to hold if not gonna see how we react at the 200
targeting a flip of red line above

crvIt has a small position in the red box and until it is broken, the lower lines are available. If the red box is broken, the red lines are available.
CRV: Reminder This Pair Will Go Up Hard Soon.Hi Everyone! Simply reminding you CRV has a lot more room to move to the upside for its Sign of Strength event. It has not transitioned from Phase C into Phase D yet; like other pairs have. Same goes for MATIC. Both MATIC and CRV are still in Phase C. Many other alt-coins are in Phase D and still working on their Sign of Strength before eventually transitioning into a "Back-Up/Last Point of Support Period."
I simply wanted to provide this VIDEO publication to explain a few details about where we are in relation to Wyckoff Method 2.0. I hope this was helpful.
Happy Trading and Stay Awesome!
David

CRV ✅i think about the end of bears and play bulls 😁
0.56 ~ 0. 58 could be a low risk zone for bulls

CRV shortCRV broke trough the ascending trendline. Asset broke trough the support level. Bearish movement to support level at 0.52 is possible.

CRV Breakdown..CRV broken down the bottom of the rising wedge pattern on 12H Time frame, correction incoming..

CRV / USDT - Bullish Momentum ContinuationTechnical Analysis:
Retest of Previous High: price has recently undergone a successful retest of its previous high, indicating a robust support level that could contribute to a sustained bullish trend.
200 Moving Average Breakout: The 200-day moving average has been convincingly breached, signaling a potential shift in the trend and attracting bullish sentiment.
Price Action and Trend Analysis:
The retest of the previous high coupled with the breakout above the 200-day moving average suggests a favorable environment for further upward movement.
Target:
Target: $0.7910
Risk Management:
As with any trade, consider implementing risk management strategies. Set stop-loss orders to protect your position in case of unexpected market movements.


long crv 4h short term tradeCRV/USDT LONG SHORT TERM TRADE 4H CHART.
5x leverage, close stop loss. move stop loss while taking profit

USDT/CRV LOW RISK/HIGH PROFIT TRADE A bit risky set up, but with such a low stop loss risk, worth taking it.
Will update as we go

CRV/USDT Back to try breakout or break down the ascending ??💎 CRV has been a major point of focus in the market, recently facing a tough rejection upon reaching the supply area. Observing CRV's movement within an ascending or bullish channel, it's clear that a recovery is needed for CRV to attempt another breakout of the supply area. Successfully achieving this could probability CRV towards our target in the strong resistance area.
💎 However, if CRV trends downwards and reaches the support trendline of the ascending channel, a robust bounce from this level is crucial to maintain the bullish trend. Failure to sustain its position at the support trendline and a potential breakdown of the pattern would indicate a shift to a bearish stance, suggesting a readiness for a downward move towards the support area.
💎 At the support level, it's essential for CRV to demonstrate a strong rebound and attempt to re-enter the ascending channel pattern. If CRV only consolidates at the support over a few days without a significant bounce, it could signal a continued downward trend, leading to a break of the support and moving towards the demand area.
