CRVUSDT 1WCRV ~ 1W Analysis
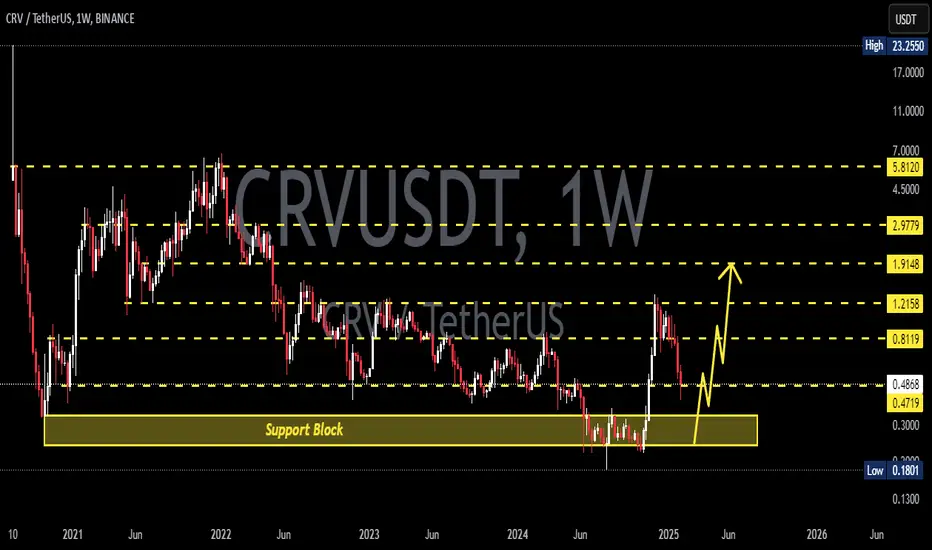
#CRV This is the lowest support for the moment If you still have a Conviction on this Coin, buy from here with a minimum target of 20%+
CRVUST trade ideas
Curve DAO CRV price analysis🤑 Did it really happen?) CRYPTOCAP:CRV price has finally “really” come out of the 3-year down trend. A confident breakout, on high volumes, "just like a book says".
💰 Now OKX:CRVUSDT price has hit the mirror level, so we can assume that the correction may be delayed to gain strength to break higher.
A correction in the range of $0.43-0.67 fits into the canons of wave analysis and will not break the structure and growth trend.
And the global 5th wave of growth #Curve DAO token can be expected at least to $4.10-5.50
_____________________
Did you like our analysis? Leave a comment, like, and follow to get more

CRV/USDT: A Make-or-Break Moment!CRV is back inside its long-term bearish channel, testing key support. If the trend holds, a potential bounce toward $0.98 (TP1) & $1.60 (TP2 ) could be in play. 🚀
However, a breakdown below $0.40 (SL) could send it to new lows. Watch this level closely!
Which way do you think CRV will go? 🔥👇

CRV Pullback for 300%??Analysis using SNR ORIGINAL chart Pattern, trade at ur own risk, u may TP at goodseller for scalping.

TradeCityPro | CRV: Navigating Curve's DEX Dynamics👋 Welcome to TradeCityPro!
Today, I'll analyze the cryptocurrency CRV from the Curve project, a decentralized exchange (DEX).
📅 Weekly Timeframe
We observe a trading range from $0.3903 to $1.2502. The price once dipped below this range to $0.2237 before rebounding, and it has now reached the upper boundary again.
🔍 Breaking the resistance at $1.2502 could signify an exit from the accumulation zone, potentially propelling the price toward higher resistances. The key weekly resistance is $6.1038, which is the all-time high, but intermediate resistances exist at $1.8428 and $2.8814.
📊 The market volume became bearish after reaching $1.2502, aligning with a market correction. The RSI has reset from the overbought region, ready to display new momentum as the market structure evolves.
🔽 If selling pressure enters the market and the price breaks below the $0.3903 support, it might suggest the previous uptrend was merely a dead cat bounce, preparing for a drop to new lows.
📅 Daily Timeframe
More details of the bullish run can be observed here. As mentioned, the price has reached up to the $1.2502 resistance and has entered a corrective phase.
✨ The correction established a floor at $0.7942, coinciding with the 0.236 Fibonacci level, though this support has now been breached. The price is forming a descending trendline, moving toward lower support levels.
🧩 The first minor support is the 0.382 Fibonacci level, not strongly backed by static price supports. The main supports are at $0.4970 and $0.3490.
📉In my view, breaking below $0.4970 would necessitate a new upward structure aiming back towards the range's ceiling. Conversely, a break below $0.3490 would end the bullish trend completely. A break below $0.2237 would initiate a bearish phase in the High Wave Cycle. Breaking below 30 on the RSI would further confirm the bearish trend.
🔼 If the price rebounds above $0.7942 and negates the current downward trend, we could consider a long position following a break of the descending trendline. The target would be modest, aimed at the top of the current box. The critical trigger for a long position remains the breach of $1.2502, a strong indicator for the start of a new bullish leg.
📝 Final Thoughts
This analysis reflects our opinions and is not financial advice.
Share your thoughts in the comments, and don’t forget to share this analysis with your friends! ❤️

CRVUSDT A LITTLE BULISH :)I’m waiting for these bullish targets to be reached with CRVUSDT. Please note that this idea is temporary and not meant for the long term.
Note: My ideas are not intended for any type of scalping or scalpers!
Here are my other ideas:

CRV : Falling Wedge As price extends further down falling wedge pattern becomes clearer. Not really out of the deep waters yet. Still one wave down to be expected.

CRV/USDT Analysis 1D Timeframe
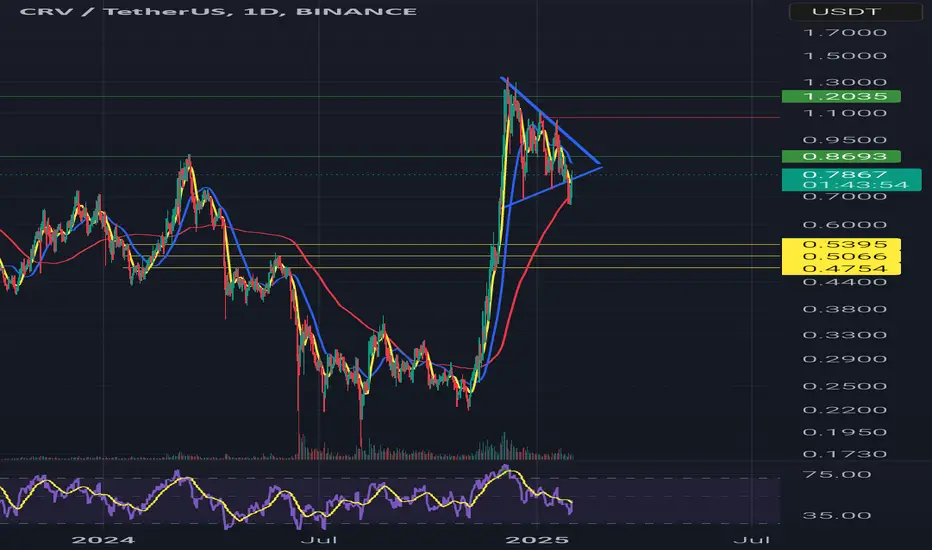
1. Technical Structure & Overall Trend
The price has recently broken out of lower lows and experienced a strong upward movement.
Currently, it is forming a symmetrical triangle pattern, indicating price compression and a potential breakout in either direction.
Moving averages are sloping upwards, suggesting a mid-term bullish trend.
Key support levels are at 0.5395, 0.5066, and 0.4754 USDT.
Major resistance levels are at 0.8693 and 1.2035 USDT.
2. Potential Trade Scenarios
✅ Bullish Scenario (Breakout to the Upside)
If the price breaks above the upper trendline of the triangle with strong volume, it could move towards 0.8693, and further towards 1.2035.
Entry: After a breakout confirmation and price stabilization above the resistance.
Stop-loss: Below the last low of the pattern (e.g., 0.70 or 0.68 depending on the breakout).
❌ Bearish Scenario (Breakdown to the Downside)
If the price breaks below the lower support of the triangle, it could retrace towards the 0.5395 and 0.5066 support zones.
Entry: After a confirmed breakdown and price stabilization below support.
Stop-loss: Above the lost support level (e.g., 0.80 or 0.82).
3. Entry Strategy & Risk Management
Conservative Entry: Wait for a breakout confirmation with a solid candle close.
Risk-to-Reward Ratio: A minimum of 2:1 is recommended for a reasonable trade.
Stop-loss & Take-profit: Set according to the chosen scenario.
Risk Management: Maintain a 1% risk per trade in line with your trading strategy.
Conclusion
The triangle pattern is nearing completion, and a breakout in the coming days is highly likely. It is recommended to wait for a decisive breakout in either direction before entering a trade.
CRV is ready to continue the rally.🏳 LSE:CRV is showing a very clean and well-formed consolidation within a "Bull Flag" pattern.
Unlike other altcoins, its December drop wasn’t as significant, which indicates that investors are not in a rush to sell their bags, and there are still new buyers even at these levels.
I have it in my portfolio, and it will be interesting to watch how it performs in the next round. 🥊

CRV LongStrong defence from bulls at demand zone between 0.3 and 0.64.
Looks like a reversal in progress. Break out long from here?

CRV Long Deviation Setup on the Monthly Time FrameLogarithmic chart.
Looks like a clean Deviation Long setup.
I've never seen a Deviation on the 1M before but this sure looks like it.
Long deviations on BTC always provided mega pumps, don't know with altcoins + this TF but yeah: willing to take the risk.
One of the best altcoin charts I've ever seen. Will sell BTC spot for this.
---------------------------------------------------------------------------------------------------------------------
Direct CC below level I think is clean but I believe it doesn't have to happen per se. Retest is clean (SFP wick) and no LL after retest.
Seeing how far price pushed above the level, closing into the structure, makes price less likely to get back to the level so there likely won't be chop on the level (price closing above and immediately closing below and vice versa).
All this makes it the perfect deviation as in this way price respects the level perfectly (which I've seen before with BTC: Nov-Dec 2022 Deviation on 1W/1M, March 2023 Deviation on 4H and Jan 2024 Deviation on 4H).

CRV's movement!BINANCE:CRVUSDT
if it can break it's symmetrical triangle upward, these are the expected targets in short term
⚠️ Disclaimer:
This is not financial advice. Always manage your risks and trade responsibly.
👉 Follow me for daily updates,
💬 Comment and like to share your thoughts,
📌 And check the link in my bio for even more resources!
Let’s navigate the markets together—join the journey today! 💹✨

CRV Long : Inverse H & S Last chance for bulls to trigger CRV rally to 3.
If bulls manage to keep price above 0.8 demand zone next area of interest is $1.3.

CRV LONG After experiencing a parabolic increase from 0.221 to 1.328, the price has oscillated within a descending trend, forming progressively lower highs. I believe there is still an opportunity to position long when the price revisits the demand zone, which aligns with the 61.8% Fibonacci retracement level and the 2024 annual opening price slightly below it. However, if the price breaks below this demand zone, another opportunity may arise around the 0.25 level, where we also have an nPOC (naked Point of Control).

Long CRVWe are at the bottom of the triangle it could be possible that we get some sort of a liquidity grab for these lows but the recovery should be very fast.
This is usual PA after a big move up that we saw for CRV.
ideal long zone is around 0.6$

crvusdt bullish trade idea.CRVUSDT did CHoCH as mentioned on the chart and doing very well. Now coming back to fill remaining liquidity below the previous day low and DEMAND ZONE. In this area we will enter long.

CRVUSDT: Trend in daily time frame (another scenario)The color levels are very accurate levels of support and resistance in different time frames, and we have to wait for their reaction in these areas.
So, Please pay special attention to the very accurate trend, colored levels, and you must know that SETUP is very sensitive.
BEST,
MT

Curve (crv)Crv usdt Daily analysis
Time frame 2hours
Risk rewards ratio >2.3 👌👈
Technical analysis
CRV is caught in a triangle. In similar cases, the price breaks out from the bottom or top of the triangle.And we'll have to wait and see where it comes from.
But why is my analysis a bullish one?
This bullish analysis is solely for the purpose of examining market sentiment.
Given the positive news we hear in the cryptocurrency market and the positive sentiment of buyers in this market, we come to this bullish analysis.
Risk rewards ratio is another good point for this analysis
Ratio 2.3 makes me a brave heart analyzer.
Only by introducing a false selling pressure can this analysis be failed. So , I put my LS in correct place. Of course I know the power of stop hunters.

Impulsive Wave 3 About To Start, Big Move Is Coming 📈 At Daily Timeframe We Had a Strong Bullish Move From 0.22$ And I Named It As a Wave 1, Currently The Price Playing At The Wave 2 And In My Idea Wave C From 2 Completed At The 0.73$ Also Double Bottom Formed At That Area, Expect a Breakout From The Trend Line And Start a Wave 3 Toward a 1.2$ And 1.71$

CRVUSDT - keep an eye on itCRV one on the most bullish coins in every bullish wave.
Daily chart shows a consolidation of symmetrical triangle pattern.
It gives positive sign as it breaks 0.5 fib , 50ema ... But still need more confirmation for being bullish
Valid to buy now
Ur target is 2$ at least in case of breakout the symmetrical triangle pattern
Best regards Ceciliones 🎯

CRV Inverse Head & Shoulders Textbook formation of inverse H&S pattern on CRV.
BTC rally as we head to trump inauguration will provide enough fuel to boost the price to $1.3 area. This will be the left shoulder breakout .

CRV price projection Great things, great minds,
The charts are speaking, and the story is one of patience and preparation. CRV has spent 952 days in accumulation, a period where the strong hands quietly load up while the market sleeps. This is the foundation of a potential explosive move, and we may just be on the brink of something special.
The recent breakout from the accumulation zone is marked by an SOS (Sign of Strength), a classic signal in the Wyckoff method that suggests the bulls are taking control. The retest of the breakout zone around $1.19 is crucial, and it's showing signs of holding—a positive sign for what’s to come.
With the chart suggesting a potential move toward $7.32, this could mean a 532% upside from current levels if the stars align. But remember, my friends, this is not financial advice—this is preparation, not prediction. The market does what it does, and our role is to stay informed and adapt.
Levels to Watch:
Support: $0.197 (strong base).
Key Breakout Zone: $1.19 (testing as support).
Target: $7.32 (long-term potential).
We’ve waited long, and the patient often get rewarded. The trend will reveal itself soon. Keep your eyes on the charts, your strategy sharp, and emotions in check. Let’s see where this journey takes us.
Stay wise and stay ready,
Lord MEDZ

$CRV Daily Bottom confirmedPretty simple stuff here. Deviation into manipulation zone and printing a B/R reversal signal with each consecutive day closing above the upper wick. Do not need to over think this here.
