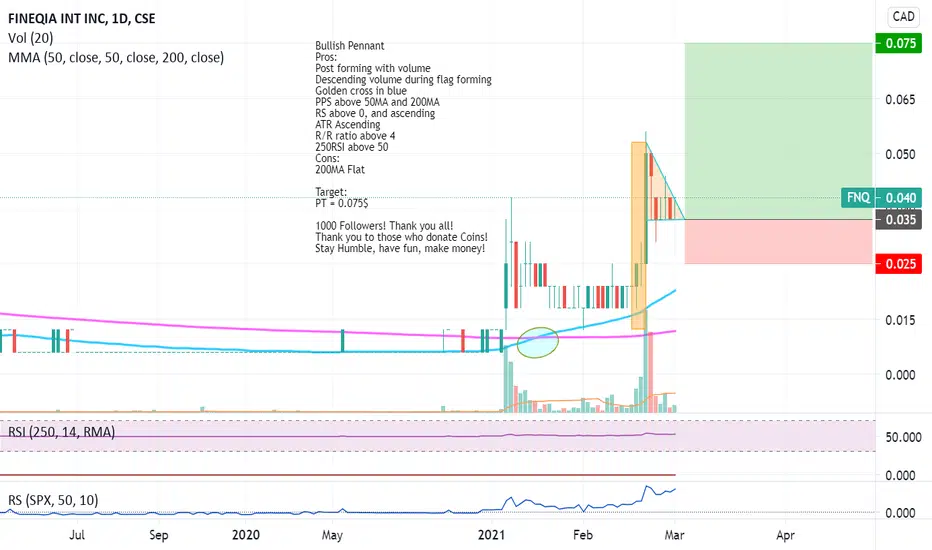
FNQ.CA: Bullish PennantBullish Pennant
Pros:
Post forming with volume
Descending volume during flag forming
Golden cross in blue
PPS above 50MA and 200MA
RS above 0, and ascending
ATR Ascending
R/R ratio above 4
250RSI above 50
Cons:
200MA Flat
Target:
PT = 0.075$
1000 Followers! Thank you all!
Thank you to those who do
−0.000 CAD
−2.52 M CAD
591.86 K CAD
1.27 B
About FINEQIA INTERNATIONAL INC.
Sector
Industry
CEO
Bundeep Singh Rangar
Website
Headquarters
Vancouver
Founded
2006
FIGI
BBG000GN4S87
Fineqia International, Inc. engages in developing a digital asset business that invests in early and growth-stage technology companies. It provides investors with institutional grade exposure to opportunities from blockchain based Decentralized Finance (DeFi). Through its subsidiaries, it issues crypto asset backed Exchange Traded Notes (ETNs) and operates as an adviser of Actively Management Certificates (AMCs) in Europe. The company was founded on June 20, 2006 and is headquartered in Vancouver, Canada.
Related stocks
Summarizing what the indicators are suggesting.
Oscillators
Neutral
SellBuy
Strong sellStrong buy
Strong sellSellNeutralBuyStrong buy
Oscillators
Neutral
SellBuy
Strong sellStrong buy
Strong sellSellNeutralBuyStrong buy
Summary
Neutral
SellBuy
Strong sellStrong buy
Strong sellSellNeutralBuyStrong buy
Summary
Neutral
SellBuy
Strong sellStrong buy
Strong sellSellNeutralBuyStrong buy
Summary
Neutral
SellBuy
Strong sellStrong buy
Strong sellSellNeutralBuyStrong buy
Moving Averages
Neutral
SellBuy
Strong sellStrong buy
Strong sellSellNeutralBuyStrong buy
Moving Averages
Neutral
SellBuy
Strong sellStrong buy
Strong sellSellNeutralBuyStrong buy
Displays a symbol's price movements over previous years to identify recurring trends.
Frequently Asked Questions
The current price of FNQ is 0.005 CAD — it hasn't changed in the past 24 hours. Watch FINEQIA INTERNATIONAL INC. stock price performance more closely on the chart.
Depending on the exchange, the stock ticker may vary. For instance, on CSE exchange FINEQIA INTERNATIONAL INC. stocks are traded under the ticker FNQ.
FNQ stock hasn't changed in a week, the last month showed zero change in price, over the last year there was no change in FINEQIA INTERNATIONAL INC. price.
FNQ stock is 0.00% volatile and has beta coefficient of 0.54. Track FINEQIA INTERNATIONAL INC. stock price on the chart and check out the list of the most volatile stocks — is FINEQIA INTERNATIONAL INC. there?
Yes, you can track FINEQIA INTERNATIONAL INC. financials in yearly and quarterly reports right on TradingView.
FNQ net income for the last quarter is −602.73 K CAD, while the quarter before that showed −275.25 K CAD of net income which accounts for −118.97% change. Track more FINEQIA INTERNATIONAL INC. financial stats to get the full picture.
No, FNQ doesn't pay any dividends to its shareholders. But don't worry, we've prepared a list of high-dividend stocks for you.
EBITDA measures a company's operating performance, its growth signifies an improvement in the efficiency of a company. FINEQIA INTERNATIONAL INC. EBITDA is −1.90 M CAD, and current EBITDA margin is −386.90%. See more stats in FINEQIA INTERNATIONAL INC. financial statements.
Like other stocks, FNQ shares are traded on stock exchanges, e.g. Nasdaq, Nyse, Euronext, and the easiest way to buy them is through an online stock broker. To do this, you need to open an account and follow a broker's procedures, then start trading. You can trade FINEQIA INTERNATIONAL INC. stock right from TradingView charts — choose your broker and connect to your account.
Investing in stocks requires a comprehensive research: you should carefully study all the available data, e.g. company's financials, related news, and its technical analysis. So FINEQIA INTERNATIONAL INC. technincal analysis shows the sell today, and its 1 week rating is sell. Since market conditions are prone to changes, it's worth looking a bit further into the future — according to the 1 month rating FINEQIA INTERNATIONAL INC. stock shows the sell signal. See more of FINEQIA INTERNATIONAL INC. technicals for a more comprehensive analysis.
If you're still not sure, try looking for inspiration in our curated watchlists.
If you're still not sure, try looking for inspiration in our curated watchlists.