HP HELLO PAL Bullish Bat harmonicWeekly bullish bat harmonic, confluent with listing price. Reading yahoo finance comments section of this stock reveals the nature of emotional devastation investors feel when buying pumped prices only to watch the stock bleed out. Maybe this catches an impulse reversal here, it looks dicey. Earnings coming out in about a week or two, the company is dependent on crypto profits, so this is either a steal or a dead duck.
HP trade ideas

Hello Pal Huge Trade Potential [PENNYSTOCK]Right out of the gate I want to point out that if you are not a user of stop losses or alerts then this trade is probably not for you as this is an illiquid asset which carries much risk.
With that being, said if you are disciplined and experienced, then we have a very intriguing trade setup here in Hello Pal International. A stock with a very low marketcap that has appeared to be exiting a distribution phase that it has been in since March.. fast forward to August and it now appears to be entering an accumulation phase if a few of the following things hold true:
1) We hold support above the $0.4609 level. This is the key level to watch as this level would be significant if held as it corresponds to the .236 fibonacci retracement of the recent all time high all the way down its second lowest low in its history, put in last September. So the fact that price has climbed its way all the way back to the level it is at right now is no small feat and requires much attention from a bullish perspective.
2) We find ourselves right above the support of another .236 fib retracement level.. this retracement however corresponds with the all time high just down to the most recent swing low at $0.4259.
This is some nice bullish confluence that seems to suggest that HLLPF could be gearing up for a major run soon.
Exactly where we are right now just $0.5095 is a decent long area with the optimum long being inside of the buy zone in green.
This means you would be very wise to have stops just below $0.4259 area as things could get very volatile quickly if there is a daily candle close below this price point.
On the other hand if support is maintained here, you could be looking at a 35% gain before hitting the first real signficant level of resistance at around $0.7042.
Above that the next major resistance level would be the 50% fib retracement of the all time high to September low mentioned earlier. If that level is reached and held as support, there would not be much in its way until the common reversal area of the .786 fibonacci level.. all the way up near $1.46. If this price point is reached that would be a total of 180% approximately. And that is assuming that the asset puts in a bearish lower high. In other words, this could go much higher.
*EXPERIENCED TRADERS ONLY
**PLZ USE STOP LOSSES AND ALERTS
***NOT FINANCIAL ADVICE

descending triangleThis Descending triangle looks like we should see a bottom at about 70 cents. looking at the triangle it should have a breakout around 20th of July. The earnings update may also speed up the breakout if they have another phenomenal month/quarter. Based on the past it may be around the 10th or so. If this is the case the breakout price should be around 75 cents. HP is well below the ichimoku cloud already, consult your charts to look for your entry point. Please leave a comment on your thoughts.


Speculative DOGE coin minerThis is the only publicly listed DOGE coin miner. Needless to say this is a speculative play but could benefit from all the hype surrounding DOGE at the moment.

HLLPF it will drop before going higher - not financial adviceHLLPF it will drop before going higher - not financial advice just a hunch
Using the FIb retracement I came up with these numbers due to weakness in the volume.


HP.CA: Bullish Pennant (88PC)Bullish Pennant (88PC)
Pros:
Volume during post formation
Descending volume during triangle formation
PPS above 50MA and 200MA
RS above 0, and ascending
ATR Ascending
R/R ratio above 6
200MA ascending
250RSI above 50
Target:
PT = 3.49$
Help how ever you can to keep this alive.
Thank you to those who have donated Coins!
Always do your own due dilligence. This is not financial advice
Stay Humble, have fun, make money!
Education:
www.dailyfx.com

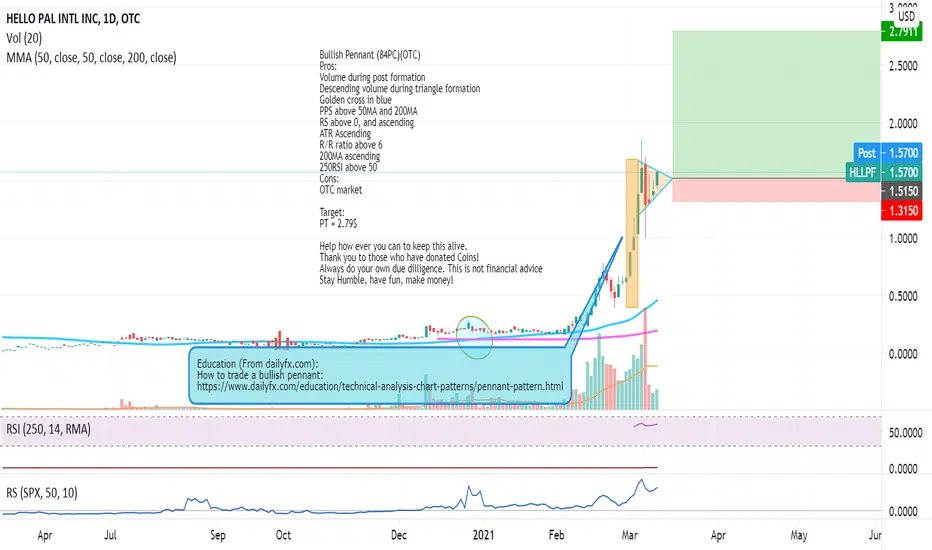
HLLPF: Bullish Pennant (84PC)(OTC)Bullish Pennant (84PC)(OTC)
Pros:
Volume during post formation
Descending volume during triangle formation
Golden cross in blue
PPS above 50MA and 200MA
RS above 0, and ascending
ATR Ascending
R/R ratio above 6
200MA ascending
250RSI above 50
Cons:
OTC market
Target:
PT = 2.79$
Help how ever you can to keep this alive.
Thank you to those who have donated Coins!
Always do your own due dilligence. This is not financial advice
Stay Humble, have fun, make money!
Education:
www.dailyfx.com
HLLPF: Bullish Flag, confirmed (OTC)Bullish Flag, confirmed (OTC)
Pros:
Post forming with volume
Descending volume during flag forming
Volume at break out
Golden cross in blue
PPS above 50MA and 200MA
RS above 0, and ascending
ATR Ascending
R/R ratio above 6
200MA ascending
Cons:
No data for 250RSI
OTC market
Target:
PT = 1.1654$
1000 Followers! Thank you all!
Thank you to those who donate Coins!
Stay Humble, have fun, make money!

HP.CA: Bullish FlagBullish Flag
Pros:
Descending volume during formation
PPS above 50MA and 200MA
RS above 0, and ascending
ATR Ascending
R/R ratio above 8
250RSI above 50
200MA ascending
Target:
PT = 1.365$
1000 Followers! Thank you all!
Thank you to those who donate Coins!
Stay Humble, have fun, make money!
