CASPER may be setting up for a 90% plus gain.CSPR has been trapped in a death spiral of decline for quite some time until the Trump Election Pump. It has since consolidated into a wedge pattern. If the price breaks out of this wedge and retests the upper (green) trendline area, the price could appreciate upwards of 90%.
I personally think that CASPER is a trash token, and I would never hold it, as its management team has clearly demonstrated that they are absolutely incompetent and likely corrupt. However, as far as trading is concerned, it could prove to be a decent trade in the short/medium term.
This trade also carries additional risk due to the poor management of the company, and this fact should not be underestimated, whether you hold tokens long term or make a leveraged trade in the short term.
Good luck, and always use a stop loss!
CSPRUSD trade ideas

CSPR - Ultra Deep Value CoinCSPR #328
"Charlie" has picked out some coins in their Golden Windows.
If you have watched the educational Fibonacci video then you will be able to draw these with a little practice.
One on the list that I haven't covered for a while that is now quite interesting is Casper.
This coin has a lot of hype.
However, the tokenomics are a little iffy since to has no known "Max Supply."
This means that coins could be infinitely minted; inflating the supply which would dilute coin holders.
But this issue is common with major coins such as Ethereum and Solana...
And similar to ETH coins are continuously minted through staking rewards.
So perhaps it should not be a major concern but certainly worth being aware of.
Another minor issue is that it doesn't have too many wallets that accept it.
Anyhow, it is of significant technical interest in this area because it has been dumping whereas other coins have been holding or moving on up.
And so it is potentially arriving to a point of ultra deep value.
The multipliers could be wild if were to pump from here.
This coin was up around 100 rank some time ago but with it slumping against other coins, it is now down at #328
Notice that it recently tapped into a 1.618 extension Golden Window.
This could be very significant I think.
Also notice that the week RSI went oversold for the first time ever.
The week RSI tends to be a very significant time frame.
Currently CSPR sits a tiny amount above the 1.618 @$0.0016.
So this is an ideal buy right here.
You could put some buy orders down at the 1.618 also.
But do note that it has already been re-tested so there is a chance that it could move on up from here.
Not advice

The beatdown in CASPER can't continue forever!Casper has been getting absolutely pounded into the dirt for quite some time now, and it can't continue forever. It has formed a mild double bottom on the hourly chart and may bounce off this bottom soon, potentially resulting in a relief rally. There are too many people who believe in CSPR, and they are bound to start buying again, either to offset previous losses, reduce their buying average, or open a new position.
Good luck, and always use a stop loss!

CASPER is likely to make a small rally to the upper trend line.CSPR has been getting beaten like a red-headed stepchild for quite some time now after experiencing some major issues with its technology. However, from a trader's perspective, I think we could see some really nice trading opportunities in the next couple of days to a couple of weeks.
Overall, I think CASPER is a complete pile of garbage, hyped by YouTube influencers, and will likely fade away into the garbage can of crypto's past sooner rather than later, but that's just my opinion.
Good luck, and always use a stop loss!

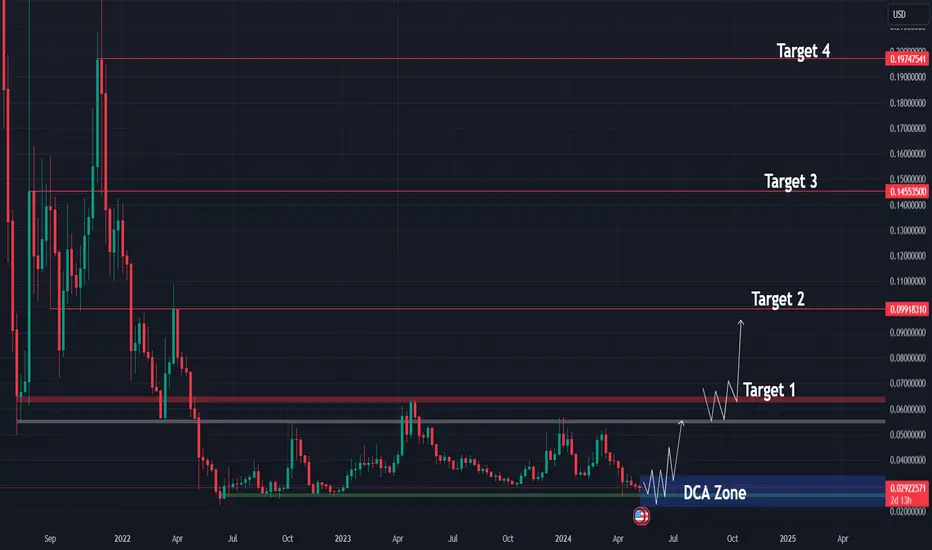
CSPR, Perfect DCA Opportunity?Sector: Layer 1, Smart Contract Platform
Market Cap: $350M
CSPR found its support level around $0.025 in June 2022 and has held it ever since. We have formed a range with an upper bound between $0.055 and $0.060.
We're now close to the lower boundary, so if you think the project has solid fundamentals, this zone is ideal for starting a DCA strategy with a small part of your wallet. We could bounce back in the next few days/weeks. Or we may make a quick visit below support level to get as many investors as possible to give up, depending on Bitcoin.
There are two Take Profit strategies open to you: take profits once we reach the upper limit of the range. Or just sell a small part if we remain bullish and manage to form a bullish structure that suggests extraction from the top and higher prices on a longer time scale.
Casper could potentially gain 40% + over the next few months.Casper (CSPR) is showing a nice chart pattern that could be indicating a nice gain over the next 2 to 3 months. I think this coin could have some very good things coming its way in terms of usage, and utility.
Good luck, and always use a stop-loss!

CSPR forecast.Looking like this for the near term.
Although if we lose 0.041, its probably more downside/consolidation.


CSPRUSD Livermore Accumulation Cylinder On The 3 Day PeriodCSPRUSD / Casper token forming a Livermore accumulation cylinder pattern on the 3 day time period. Point 7 also at an area of support and resistance. The question is will point 7 hold or will it break down below point 6?

Head and shouldersShort term, I anticipate a drop to .026 cents where there is prior support.
There's a clear head and shoulder pattern on the daily candle chart.
Long-term, I'm very bullish. But as for the rest of the month I see a large dip in the market.
Historically, this is how every September has been and all indicators aren't saying otherwise.
Hopefully this is the last chance to buy below .03

CSPRUSD At An Interesting Level Of Support Inside A Channel CSPRUSD / Casper token is at an interesting level of support inside a parallel channel. Seems to also be sitting at a level of horizontal support. Minimum target is around 0.07 - 0.08 which is at upper level of channel. It also coincides with a previous level of support and resistance as identified by the blue band.
Will be interesting if this channel holds as support.

Casper (CSPR)Casper, like many crypto projects, went down after lunch. Then CSPR started to oscillate in a triangular shaped pattern. Recently, buy volume increased, and it seems Casper wants to try and break the upper horizontal area. Let's see if it can do it or not.

CSPR working on a double bottom breakoutThe enckline of the double bottom, which is also the top trendline of this rising channel shown here. Is currently still resistance, however should it start to close a few consecutive weekly candles above this neckline/top trendline and then trigger the breakout the target would be around 9 cents. *not financial advice*

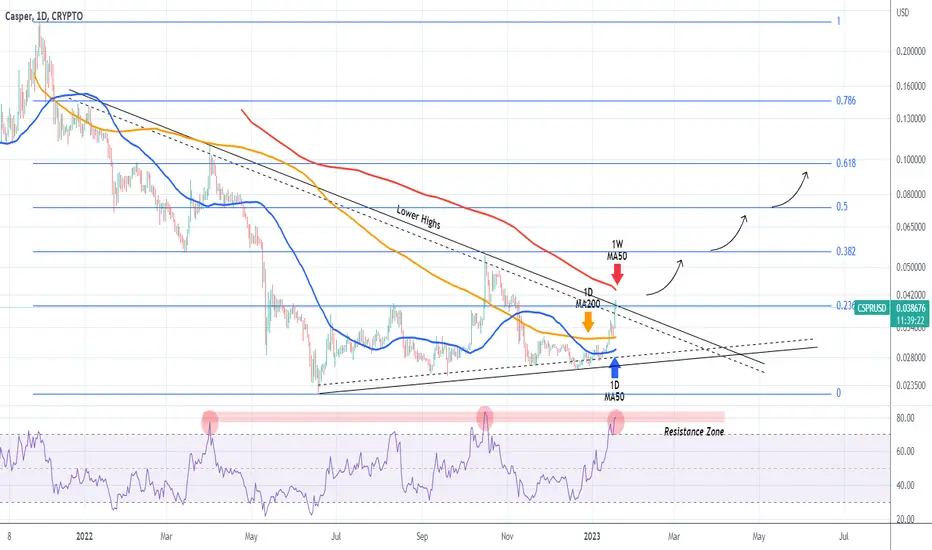
CSPRUSD Close to a major bullish break-out!Casper (CSPRUSD) broke today above the Lower Highs trend-line that has been in effect since late December 2021. This is the Resistance level that suppressed the price action throughout the whole Bear Cycle. If it manages to close the candle above it, preferably the weekly, it will be a major bullish development with confirmation coming when the price breaks above the 1W MA50 (red trend-line).
Right now we are on the ultimate Resistance cluster as the 1D RSI is also struggling on the Resistance Zone that is holding since March 31 2022. A Triple Top there would delay the upside for a month or so, but since the price is trading on Higher Lows (since the June 18 market bottom), it is a matter of time before Casper breaks upwards.
As you see, the Fibonacci retracement levels fit almost perfectly with Support/ Resistance levels during the downtrend of the Bear Cycle, and can provide us with a guide as targets on the new Bull Cycle.
-------------------------------------------------------------------------------
** Please LIKE 👍, FOLLOW ✅, SHARE 🙌 and COMMENT ✍ if you enjoy this idea! Also share your ideas and charts in the comments section below! **
-------------------------------------------------------------------------------
💸💸💸💸💸💸
👇 👇 👇 👇 👇 👇
CSPRUSD Growing slowly but surelyPattern = Ascending Triangle
Action = Buy on the ascending support, Sell on the Resistance Zone. Buy if the top of the Resistance Zone breaks.
Target = 0.054120 (the high of October 16th).
Please like, follow and comment!!
