Cartesi (CTSI) formed Gartley move for upto 73.5% bullish rallyHi dear friends, hope you are well and welcome to the new update on Cartesi (CTSI) token with Bitcoin pair.
Previously we had a good trade of CTSI token.
Now again on daily time frame chart, the price action has formed final leg of bullish Gartley pattern.
CTSIBTC trade ideas

CTSI On The Trend Line CTSI comes down on the trend line. Also it's near the median line of pitchfork and the doji and hammer candles closed above the EMA 60 can be a signal of reversal from here. Stop can be set under the trend line. Good luck !👍

Crypto|CTSI/BTC|Long and shortLong and short CTSI/BTC
Activation of the transaction only when the blue zone is fixed/broken.
The author recommends the use of anchoring fixed the blue zone, this variation is less risky.
If there is increased volatility in the market and the price is held for more than 2-3 minutes behind the activation zone after the breakdown, then the activation of the idea occurs at the prices behind the activation zone.
Working out the support and resistance levels of the consolidation zone.
* Possible closing of a trade before reaching the take/stop zone. The author can close the deal for subjective reasons, this does not completely cancel the idea and is not a call to the same action, you can continue working out the idea according to your data, but without the support of the author.
+ ! - zone highlighted by the ellipse is a zone of increased resistance, in this area there is a possible reversal for a correction, please take this factor into account in this transaction.
The "forecast" tool is used for more noticeable display of % (for the place of the usual % scale) of the price change, I do not put the date and time of the transaction, only %.
The breakdown of the upper blue zone - long.
Breakdown of the lower blue zone - short.
Working out the stop when the price returns to the level after activation + fixing in the red zone.
Blue zones - activation zones.
Green zone - take zone.
Red zone - stop zone.
Orange arrows indicate the direction of the take.
Red arrows indicate the direction of the stop.
Priority - The value of the priority parameter implies the author's subjective opinion about the more likely activation zone on this idea, this does not mean that this idea will be 80% activated by this parameter, the purpose of the parameter is to provide for the risk of the inverse of the zone parameter.
Example: "Priority Long: So the author inclines more in the direction of the activation zone open long trades, in this case, when reaching the activation zone in short you should be very careful, because this area may be highly likely to be punched about the breakdown/do not get to take/activate transaction from go to stop."
Please consider this parameter if you use my ideas.
SUM PNL: This parameter displays the total % of all closed ideas of the "new" format (according to the author) for this sector at the time of publication of the idea. The calculation is very "clumsy" just the sum of the profits of all the ideas, based on this indicator, you can more accurately assess the risks when working with my ideas of this sector. I present you the construction of the idea, you can use it yourself as you like based on your subjective view and risks, the calculation of the PNL indicator is carried out only on transactions that the author closed on TV in manual mode or by take.
P.S Please use RM (risk management) and MM (money management) if you decide to use my ideas, there will always be unprofitable ideas, this will definitely happen, the goal of the system is that there will be more profitable ideas at a distance.

CTSI is ready!Here's another trade setup for you all.
CTSI/BTC looks amazingly bullish here.
Perfect breakout and retest.
Enter long at 672 to 700 sats.
Targets:
796 Sats.
919 Sats.
1027 Sats.
Remember to put a stop loss at 630 Sats.
Have a good trade, guys.
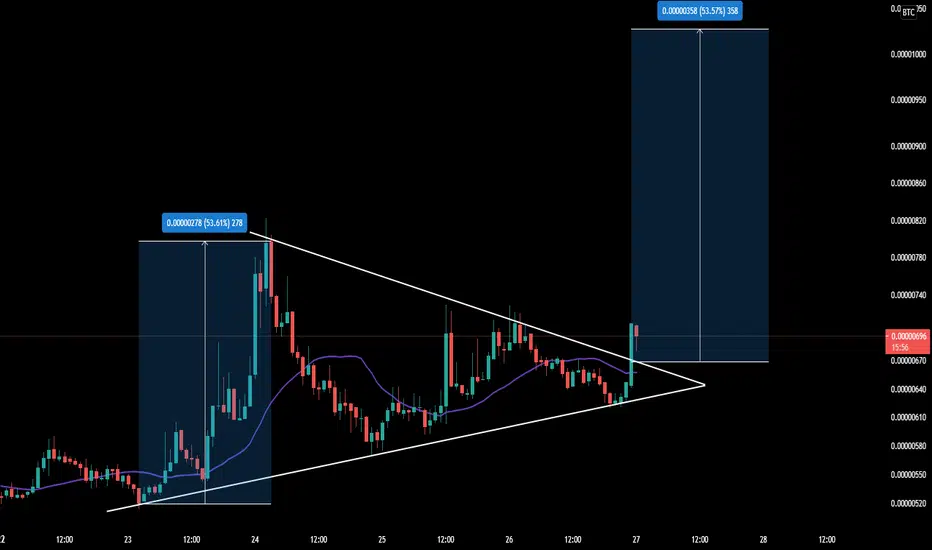
#CTSI/BTC Breaking out ready for Potential 85% Rally.Welcome to this quick altcoin setup.
CTSI is breaking out with all the strong fundamentals in the coming few weeks.
Expecting this one to perform well.
Technically it broke out of the triangle showing signs of accumulation at this price level.
ENTRY: 512 TO 540
TARGET:
687
715
845
937
SL : 467
DYOR before taking this trade.
Do hit the like button if you like my setups and 100% accurate BTC updates.
Thank you
#PEACE

CTSIBTC is creating a symmertical triangle 🦐📐The price is testing the upper resistance of symmetrical triangle. IF the price will have a breakout and test the current resistance as new support, According to Plancton's strategy (check our Academy), we can set a nice order
–––––
Follow the Shrimp 🦐
Keep in mind.
🟣 Purple structure -> Monthly structure.
🔴 Red structure -> Weekly structure.
🔵 Blue structure -> Daily structure.
🟡 Yellow structure -> 4h structure.
⚫️ Black structure -> <4h structure.
Here is the Plancton0618 technical analysis, please comment below if you have any question.
The ENTRY in the market will be taken only if the condition of the Plancton0618 strategy will trigger.

CTSI breakout confirmed, Buy at RetestCTSI breaks the long resistance and now retesting it. CTSI is a Binance Launchpad project and we all see how launchpad coins are pumping. CTSI has very good fundamentals and a lot of developments and news are coming in the next few weeks. This is a good time to build your position in CTSI.
Buy Zone: 560-570
Target: 625-650-700-785-860-934-1035

CTSI/BTC looks good!Cartesi is consolidating inside a symmetrical triangle after being rejected by the diagonal resistance for a 3rd time. If it breaks it I expect massive volumes to pour in.


CTSI can go a lot higher, what do u think?This is not a financial advice. Always do your own research and always put stoploss in your trade (SL) :) If you want more detailed info how to study and read charts or just need help with some coin, just write to me here personal message, i will try to answer to everybody... i can help you :) all for free, don't worry, BE HAPPY!
If u like the analysis, please feel free to ask any question about this TA or crypto or any coin and also leave a comment or like or share the idea if u like, i really appreciate it because then my work makes sense :) thanks!

CTSI look fresh and juicy! SL is a must!This is not a financial advice. Always do your own research and always put stoploss in your trade (SL) :) If you want more detailed info how to study and read charts or just need help with some coin, just write to me here personal message, i will try to answer to everybody... i can help you :) all for free, don't worry, BE HAPPY!


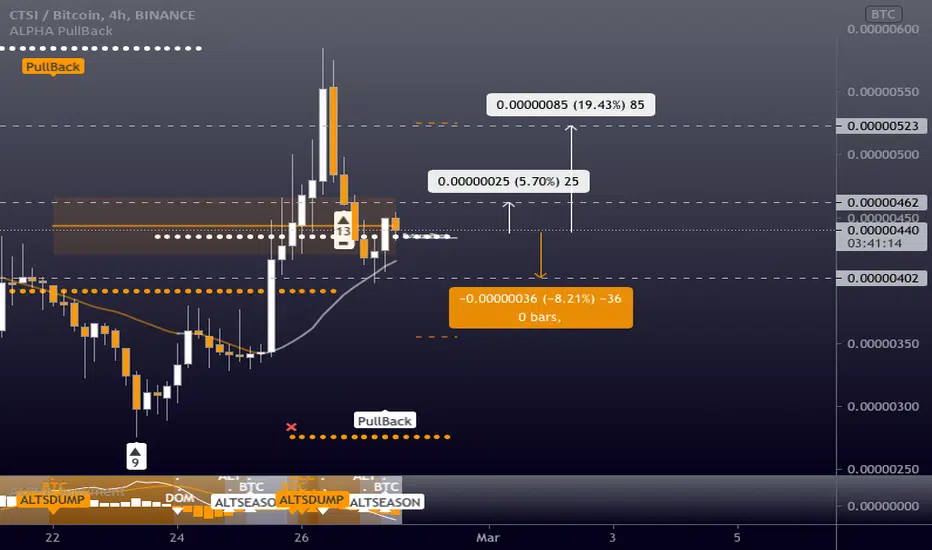
CTSIBTC - Long - Potential 19.43%CTSIBTC - Long - Potential 19.43%
Entry- 438
TP1- 462
TP2- 523
SL- 402
- Trigger - Volume / TD9
- BTC - Alts Recovering - Manage Trade As BTC Rejection Possible
- RR - 2.4
- Trailing Buy - 1%
- Trailing Profit - 1%
- Trailing Stop-Loss - no
CSTI with BTC pair formed Gartley for upto 185% bullish moveHi dear patrons, hope you are well and welcome to the new update on Cartesi (CTSI) token with Bitcoin pair.
On the daily time frame chart, the priceline of CTSI with BTC pair has completed the final leg of the bullish Gartley and entered the potential reversal zone. There is also 200 SMA support in buying.
This trade has a huge profit possibility up to 185%, and the loss possibility is 34%.
Note: Above idea is for educational purpose only. It is advised to diversify and strictly follow the stop loss, and don't get stuck with trade.

Low data chart, but really clear acumulation range shownThe consolidation is done, just see the spikes the price has every time that demand has reacted.


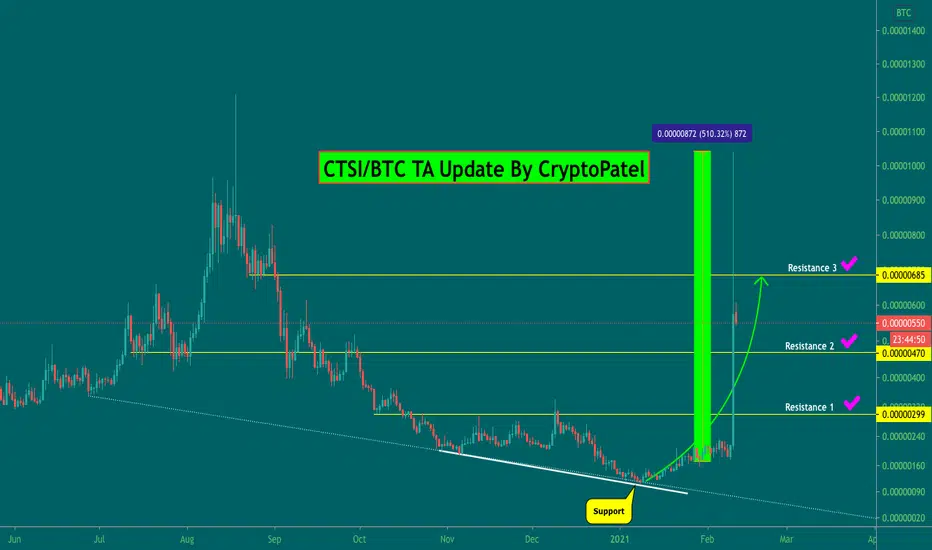
CTSI/BTC now 600% profit so Please profit Guys#CTSI/BTC profit update:-
#CTSI/BTC currently trading at 580 Satoshi and Went upto 1000 Satoshi.
600% pure profit guys.
Hope you all are happy with my analysis.
Entry:- 170 Satoshi
Targets:-
Target 1:- 299 ✅
Target 2:- 470 ✅
Target 3:- 685 ✅
Target 4:- Moon ✅
Please click LIKe button and Appreciate my hard work.
Must follow me for latest crypto real time updates.
Thank you.
CTSI Cartesi has to decideCan we see more upside or are we going to correct
Indicators and Bitcoin rising again telling me we could go down VS BTC
But
Lot's of events in calendar: coinmarketcal.com
Tell me what you think?

CTSIBTC_DailyEnter if and only if:
Resistance level Cross up happened!
**************************************
Price : 181 Sat
Entry LVL: 180 -240 Sat
Depending on your risk appetite!
Resistance Zone: 187 -203 Sat
Expected Return: 67%- 132%-182%
Reward/Risk: 5.4
TP_LVL I: 306 Sat
TP_LVL II: 421 Sat
TP_LVL III: 514 Sat
SL: 143 Sat
**************************************


CTSI/BTC Bullish Chart and 350% potential from here#CTSI/BTC TA Update :-
#CTSI now trading above support level so Now bullish as per chart.
So As per Technical analysis Bullish diversion play in chart.
So I am buying here at current Market Price.
When it will cross 200 satoshi then next stop will be 500+ satoshi
Fundamental also very bullish.
Entry:- CMP
Targets :- 299/470/685 Satoshi
Stop loss:- 143 Satoshi
Please Click LIKE button and Appreciate my hard work.
Must follow me for latest crypto real time updates.
Thank you.


CTSIBTC - Long - Potential 19.38%CTSIBTC - Long - Potential 19.38%
Entry- 146
TP1- 155
TP2- 174
SL- 133
- Key Notes - High Risk at the moment - Raise S/L at TP1
- RR - 2.22
- Trailing Buy - 0.5%
- Trailing Profit - 1%
- Trailing Stop-Loss - no
