CTSI BTCYou are responsible for your choices. You are responsible for your money - a bullish triangle
CTSIBTC trade ideas

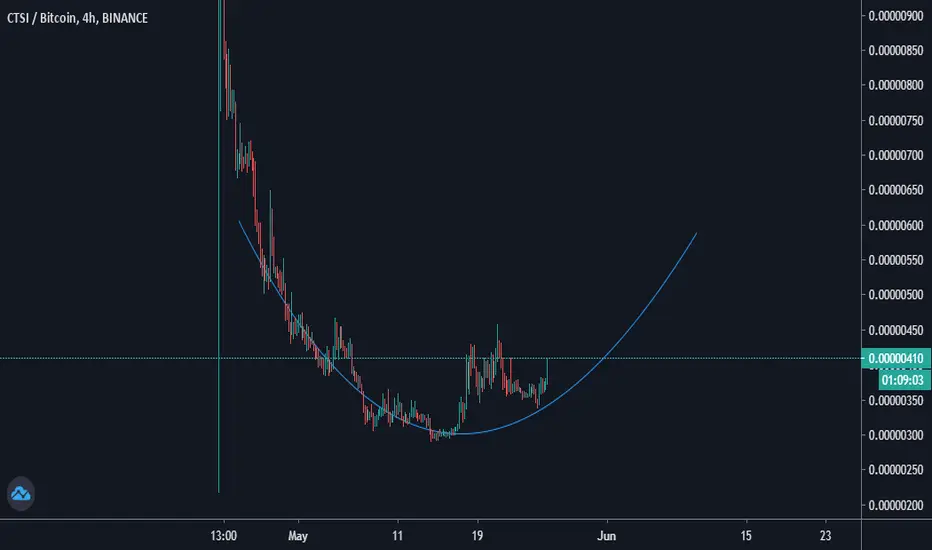
CTSI Cup and Handle, Invese H&SCTSI with the round bottom.
Forming a handle with an inverse head shoulder.

CTSI/BTC Long Analysis
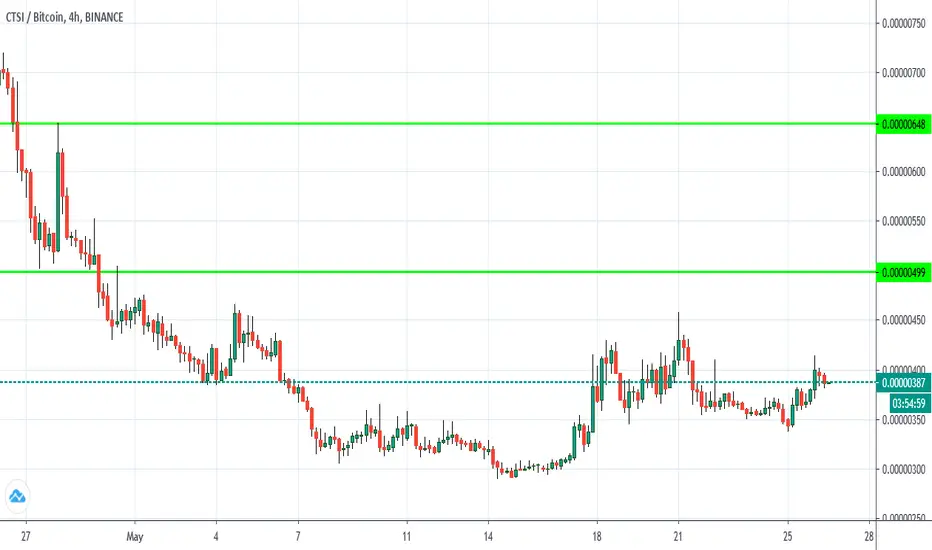
CTSIBTC Holding the green support.
Watch for a bullish candle on the LTF.
Golden Cross on the 4H chart.
If price breaks 430 its a successful Cup and Handle formation.
Leave a like if you agree :)

We are now at a crossroadsThe chart shows everything
There are two possibilities ahead of me now
The first possibility is an increase from the current price of 400 to 332-355, thus forming a head and shoulders pattern, and the price is reversed
The second possibility ends the correction wave and break the resistance 455 and continue the bullish path targets 512 and 621

CTSI/BTC 48% profit and still solid uptrend#CTSI/BTC TA Update:-
#CTSI Now 40%+ up from our entry price.
I update you when price dowb till 330 Satoshi to add more #CTSI
Hope you happy with Profit.
After broken Inverse Head & Shoulder pattern i can expect more upward rooms.
But if you happy with 48% Profit then you can Book profit partially.
Support :- 426/370 Satoshi
Resistance:- 619/700 Satoshi
Please Click LIKE Button and Appreciate me for my Hard work.
Must follow me for latest crypto Updates.
Thank you.

CTSI Price at Resistance price at horizontal resistance if close above we can see a really good rally in this coin
wait for price to close above resistance

CTSIBTC Nice breakout and flip a resistance 🦐CTSIBTC Nice breakout and now the price flips a resistance
According to Plancton strategy, we can set a nice order
–––––
Here is the Plancton0618 technical analysis, please comment below if you have any question.
The ENTRY in the market will be taken only if the condition of Plancton0618 strategy will trigger.

CTSI Cartesi breakout on 12h - Bullish signal - 100% to 150% Beautiful breakout on 12h and 24h charts. Cartesi have a lot more to give with this month until catalyst in August (insider). Volume is back and whale entering slowly. The next TFUEL :)


Triangle for CTSIToday only one altcoin brokeout the bollinger upper band in daily chart then it’s still rising 🧐
It’s also formed triangle


long ctsi/btcplease be patient , btc BIG candle is coming
you can buy after btc shake and buy in the deep :))


On a Long Term Support Line ,Buy Zone ,High R/R📡 CTSI / BTC
🌐 Exchange : #BINANCE
▶️ Buy : 330
👇 Targets :
✅ Tp 1 : 357 (8%)
✅ Tp 2 : 384 (16%)
✅ Tp 3 : 415 (26%)
🔴 Stop loss zone : 305 ~ 300


CTSI/BTCFor the CTSI bagholders, this chart looks decent and is due for a imminent pump. The price has broken the diagonal resistance, retested it perfectly, which coincides with BTC's volatility. There is also a slightly bull divergence on the 4hrs which could strengthen my bias.
Note: If you like the content and the setup, please give me a follow not to miss out on many altcoins charts to come.

#CTSI/BTC (May 31)At this moment, what we can see on CTSI chart is that the selling force is dominant and the purpose of pushing the price up is to sell large quantities of CTSI.
In addition, CTSI is in a very bad pattern, Symmetrical Triangle in downtrend, so the price direction is moving down.
We will buy CTSI in 2 cases :
- Break out and stand stable above 400sts
- Catch gradually at these points : 320 - 280 and 250sts
The nearest sell target is 450 and 500


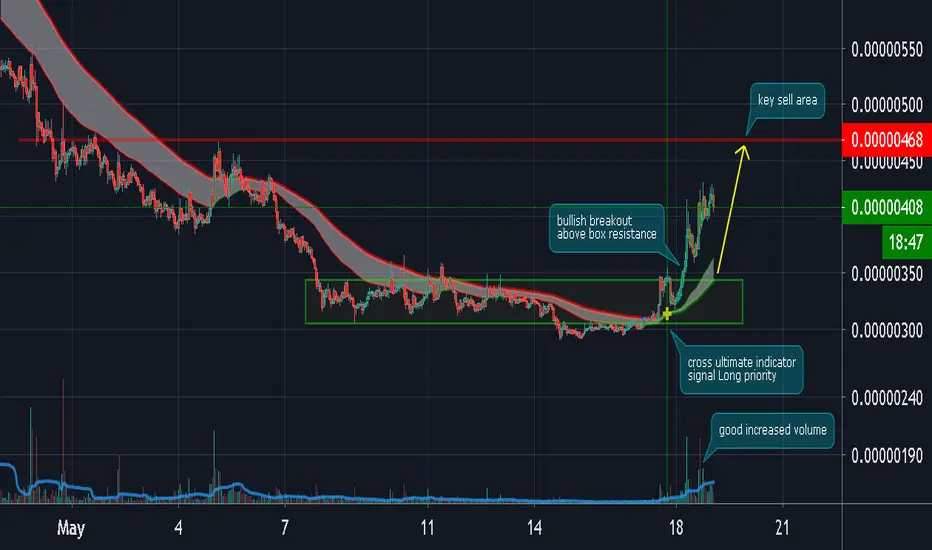
CTSI/BTC (Short Term Uptrend)CTSI/BTC
-bullish local resistance breakout of box
-good increased in volume
-cross ultimate signal is Long priority
-uptrend structure on 1H time-frame
-upside potential is up to 470-500
-if you have a position during breakout
-trail your stoploss at 385
Cartesi Breaks Falling Wedge (Short-Term Move)CTSIBTC just broke above resistance and is starting to gain momentum.
I've marked the next short-term target on this chart.
Cartesi (CTSIBTC) Chart Signals
Here we can notice the volume bars going green and becoming bigger, there can easily be more growth.
EMA10 is moving above EMA50.
We also have a strong RSI.
Prices can go straight up as shown by the green arrow.
Conditions for change
On a drop, support can be found around 0.00000333.
Thanks a lot for reading.
Namaste.
