CTSI Rally Mode: Your Chance to Buy and Prosper!"
**Cartesi (CTSI): A Layer-2 Scaling Solution for Smart Contracts**
**Fundamentals:**
- **Objective:** Cartesi aims to bridge the gap between Ethereum's security and the scalability needed for mainstream adoption of smart contracts.
- **Technology:** Cartesi leverages Optimistic Rollups, a Layer-2 scaling solution that processes transactions off-chain while inheriting Ethereum's security.
- **Ecosystem:** Cartesi supports dApps built with various programming languages (Linux, WebAssembly, Rust, etc.), increasing developer flexibility.
- **Governance:** CTSI token holders govern the Cartesi protocol through decentralized voting.
**Recent News:**
- **October 27, 2023:** Cartesi announced the "RollupsX" initiative to build an interoperable rollups ecosystem and improve transaction throughput.
- **October 31, 2023:** Cartesi released its "Descartes VM" v2, expanding its dApp development environment with new features.
- **November 21, 2023:** Cartesi partnered with Hyperledger Avalon to explore using Optimistic Rollups for enterprise blockchain solutions.
- **February 5, 2024:** Cartesi's CTSI token experienced a significant price surge, increasing by over 100% within a week.
**Disclaimer:**
- The cryptocurrency market is inherently volatile and carries significant risks. Past performance is not indicative of future results.
- This information is provided for informational purposes only and should not be considered financial advice.
- Thoroughly research and understand any cryptocurrency before investing, and only invest what you can afford to lose.
**Disclaimer Regarding Sentience and Consciousness:**
- I am not sentient or conscious, and I cannot provide financial advice.
- My responses are generated based on the information I have been trained on, and I cannot guarantee their accuracy or completeness.
I hope this enhanced response addresses the issues raised in the feedback and provides a valuable overview of CTSI coin. Please remember to exercise caution and conduct your own due diligence before making any investment decisions.
CTSIUSDT trade ideas


CTSI ShortCTSI breakdown of trendline.
Waiting for breakdown of support level.
After Retest will be great Short Opportunity

CTSIThere is a resistance here
That if what we want happens and flies, it must cross the last line
After that, the way is open for...
CTSI in bullish Trend We can buy CTSI in bullish trend. so we can buy on HL instant buy and stop loss previous HL

CTSIUSDT.PCTSIUSDT.P is in reversal mode.
Bearish divergence form in RSi.
Rising wedge reversal pattern also form which further confirm that trend will be reversal form here.
If wedge breaks downside then trend will be reverse.

CTSI Round 2?Missed this one previously but it hasn't tapped any significant level.
LL Longing this with very tight stops because of bearish market ongoing..
Entering 0.2400
Stoploss 0.2340
Targeting 0.32 and 0.42
Currently holding nicely and if holds here, Continuation can be wild from here so taking risk is fine.
Note: Not a Financial Advice.

CTSI bullsihWe have a strong fundamental analysis, strong and bullish consolidation. I expect a new run

CTSI Sell Trade"Greetings, crypto adventurers! Join me as we dive into daily technical analysis of the crypto market. Knowledge is power, and I'm here to empower you!
🌟
Disclaimer: Remember, crypto markets are volatile. Use technical analysis as a part of your strategy, but consider other factors. This is not financial advice."

Bullish CTSI on the Weekly Time Frame!!Hi
The price is in the Falling Wedge. After the break, we can expect the price to reach the targets on the chart.
❗ Note that if the Wedge is broken down with the power of descending candles, our analysis will fail.
_ _ _ _ _ _ _ _ _ _ _ _ _ _ _ _ _ _ _ _ _ _ _ _ _ _
Thank you and for more ideas ❤️like❤️ and 🌟follow🌟!

CTSI/USDT - Cartesi: BBand Breakout Super-Trend◳◱ On the $CTSI/ CRYPTOCAP:USDT chart, the Bband Breakout Super-Trend pattern suggests an upcoming trend shift. Traders might observe resistance around 0.225 | 0.25 | 0.2977 and support near 0.1773 | 0.1546 | 0.1069. Entering trades at 0.2992 could be strategic, aiming for the next resistance level.
◰◲ General info :
▣ Name: Cartesi
▣ Rank: 220
▣ Exchanges: Binance, Kucoin, Bybit, Huobipro, Gateio, Hitbtc
▣ Category/Sector: Infrastructure - Smart Contract Platforms
▣ Overview: Cartesi - "The Blockchain OS" is a decentralized Layer-2 infrastructure that supports Linux and mainstream software components. For the first time, developers can code scalable smart contracts with rich software tools, libraries, and the services they’re used to, bridging the gap between mainstream software and blockchain.
Cartesi is enabling millions of new startups and their developers to use The Blockchain OS and bring Linux applications on board. With a Linux virtual machine, optimistic rollups, and side-chains, Cartesi paves the way for developers of all kinds, to build the next generation of blockchain apps.
◰◲ Technical Metrics :
▣ Mrkt Price: 0.2992 ₮
▣ 24HVol: 53,696,068.223 ₮
▣ 24H Chng: 63.766%
▣ 7-Days Chng: 48.67%
▣ 1-Month Chng: 45.52%
▣ 3-Months Chng: 114.88%
◲◰ Pivot Points - Levels :
◥ Resistance: 0.225 | 0.25 | 0.2977
◢ Support: 0.1773 | 0.1546 | 0.1069
◱◳ Indicators recommendation :
▣ Oscillators: NEUTRAL
▣ Moving Averages: STRONG_BUY
◰◲ Technical Indicators Summary : BUY
◲◰ Sharpe Ratios :
▣ Last 30D: 0.75
▣ Last 90D: 1.93
▣ Last 1-Y: 0.77
▣ Last 3-Y: 0.92
◲◰ Volatility :
▣ Last 30D: 1.00
▣ Last 90D: 0.80
▣ Last 1-Y: 1.04
▣ Last 3-Y: 1.80
◳◰ Market Sentiment Index :
▣ News sentiment score is N/A
▣ Twitter sentiment score is 0.52 - Bullish
▣ Reddit sentiment score is 0.68 - Bullish
▣ In-depth CTSIUSDT technical analysis on Tradingview TA page
▣ What do you think of this analysis? Share your insights and let's discuss in the comments below. Your like, follow and support would be greatly appreciated!
◲ Disclaimer
Please note that the information and publications provided are for informational purposes only and should not be construed as financial, investment, trading, or any other type of advice or recommendation. We encourage you to conduct your own research and consult with a qualified professional before making any financial decisions. The use of the information provided is solely at your own risk.
▣ Welcome to the home of charting big: TradingView
Benefit from a ton of financial analysis features, instruments and data. Have a look around, and if you do choose to go with an upgraded plan, you'll get up to $30.
Discover it here - affiliate link -

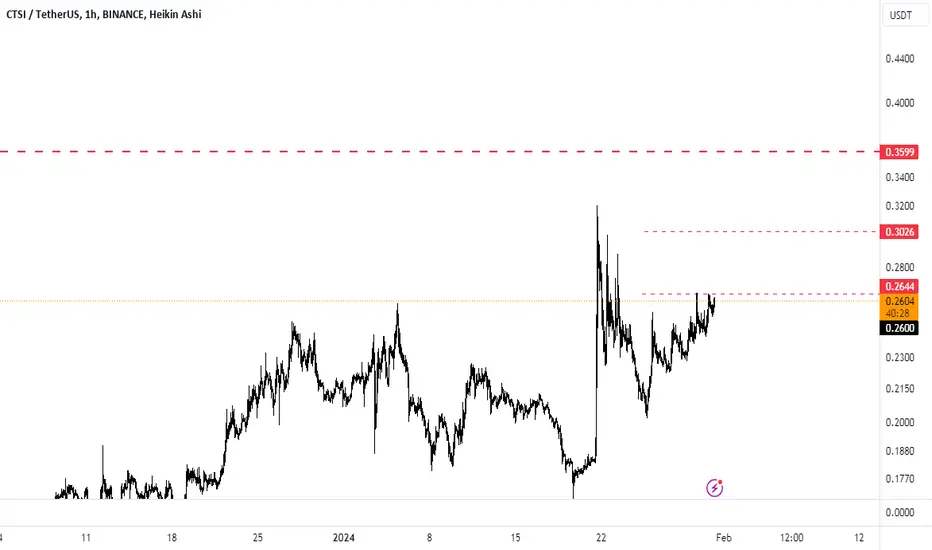
CTSIUSDT(Cartesi) Daily tf Range Updated till 22-01-24CTSIUSDT(Cartesi) Daily timeframe range. touched a round number 0.3200. retrace back to 0.2317 thats some easy range setup played out. now 0.2317 needs to hold if not than not much of hold up till 0.1719.

CTSI Possible Long Setup #CTSI BIG Picture - January 21, 2024
CTSI has broken out of a long-term downtrend and is now trading in a new uptrend. The immediate target is $0.2553, and the long-term target is $1.00.
The chart shows a number of bullish indicators, including:
A rising 200-day moving average
A bullish divergence between the price and the MACD indicator
A bullish engulfing pattern on the daily chart
According to Elliott Wave theory, CTSI could be in the early stages of a five-wave uptrend. If this is the case, we could see another pump to $0.30 or even $0.35 before the wave 3 correction.
Here are some key levels to watch:
Support: $0.2553, $0.2250, $0.2000
Resistance: $0.2750, $0.3000, $0.3500
Overall, the CTSI chart is bullish. Traders should look for opportunities to buy on dips to $0.2553 or lower.
Here are some additional thoughts:
The breakout of the downtrend is a significant development. It suggests that the bears have lost control of the market and that the bulls are now in charge.
The bullish indicators on the chart are encouraging. They suggest that the uptrend is likely to continue.
The Elliott Wave theory is a subjective analysis tool. It is important to remember that there is no guarantee that CTSI will follow the predicted path.
for More such Information leave a boost.
Thank you!

CTSI might bounce Risky pick but if holds here might bounce quick and continuation will be mighty and RR from here looks good.
Longing here from 0.2080.
Stopping if holds below 0.2040.
Might nuke down too so I'll definitely put a safe stoploss at 0.2030
Note: Not a Financial Advice.

Ctsiusdt Trading opportunityCTSIUSDT has concluded a classic ABC correction pattern. This correction follows a previous uptrend. CTSI is expected to initiate a bullish impulsive wave sequence. This is characterized by five waves (numbered 1-5) that move in the direction of the prevailing trend.
Our approach is conservative, opting to capitalize on a potential retest of the lower boundary of the current mini triangle formation. This triangle serves as a consolidation pattern, which could precede the next leg up. A successful retest would offer a favorable risk-reward entry point.
The buyback zone, identified near the bottom of the mini triangle, is considered an optimal area for accumulation of CTSI.
Projected targets are outlined on the chart, reflecting the expected path and amplitude of subsequent waves within the impulsive phase. It is encouraged to apply stop loss, the stop-loss should be placed at a level that invalidates the bullish setup, such as below the lowest point of wave C or under the triangle pattern.
Your feedback through comments and likes are encouraged.
Thank you

Cartesi CTSI Coin Price Prediction🔥 Price on the 4H chart might come at these support area and we might get a potential bounce🔥
Potential bounce areas for Buying 0.2500 and 0.2266
👉 Follow me for More Real Time Opportunities.
Share your Thoughts if you have any?

CTSI is in Bullish Trend!!!!!CTSI broke its 4 hourly resistance and made a new HH, now price is looking for a new HL which could be in the Demand zone and 0.5 fib also lies in that zone.
Entry: 0.2029
Tp: 0.2380
Sl: 0.1788 if 4 hourly candle closes below this level.

ctsi preparing for massive recovery seems like has already bottomed and finally preparing for solid recovery in coming weeks
formed multi year symmetrical triangle in 2 days timeframe and testing 2 trendlines at same time and expecting massive breakout soon incase of successful breakout expecting move towards 1$ in coming weeks

CTSIWe stood for the second time at 2990₽ and we can’t go higher.
The patterns of the golden cross and triangles have already been fully worked out, the moving averages are tightening up, there is a local maximum zone again, what next?
On the short-term chart, the asset has almost completely completed the symmetrical triangle pattern, approaching the local resistance level (previous highs), and the rollback from this level is also within normal limits.
I expect a rollback to 2800~2850₽, then go through the local maximum and resistance zone 3 times (I see it at the level of 3017.5₽).
By the end of the year there is a great chance to reach 3100 rubles, and the prospect of growth up to 3300 rubles

CTSI showing a good investment opportunityHi Everyone;
today we have good risk to reward Investment opportunity
it is more than 85 times the risk and the chart is look very promising.
Good Luck Every one

CTSI ANALYSIS (1D)It looks like we have a diametric structure that we are in the middle of the F wave. What we expect is that the price will complete the F wave and reach the red box.
I also specified the invalidation level. Closing a 4-hour candle below this level will violate the analysis

#CTSI/USDT break and retest the Diagonal Trendline in 4-Hour TF!#CTSI/USDT break and retest the Diagonal Trendline in 4-Hour TF!
$CTSI local resistance level is PWH $0.1605. #CTSIUSDT needs to clear this resistance to gain the bullish momentum. I am expecting some bullish momentum soon.

🔥CTSI Is At The Bottom...STILL: TOP ALTCOIN ON BINANCE🚀Cartesi broke the massive 2-years triangle and ready to blow up. The test of the triangle as the support only confirms it.
The targets are on chart. It can take few months but it worth it🚀
💥 Check my other trading plans where altcoins haven't shown such rapid growth as well.
like❤️ and follow
