CTSI/USDT. BitVero Crypto Academy.
Disclamer:
We are not financial advisors. The content that we share on this website are for educational purposes and are our own personal opinions.
CTSIUSDT trade ideas

CTSIUSDT #CTSIUSDT
we published and shared this idea with you and gave very good profits
Target 2️⃣ : done✅
Price reached : 0.1750$ ✅
Profit: 58.08%🚀🤑

NICE PULLBACK As you can see there is a great pullback to this trend and then it can be ready for a rise

Cartesi Starts To Recover | Easy 80%+ PotentialWe can say CTSIUSDT (Cartesi) has gone full circle after a 94.65% correction and 364 days of bearish action (from ATH to a new multi-year low).
Here is the chart:
In this same chart we can appreciate 1 week of consolidation after a new low, this low took CTSIUSDT back to August 2020 prices, and then 3 weeks closing green.
We have a volume breakout.
CTSIUSDT moving above EMA10 and a strong RSI above 50 weekly.
This is another altcoin pair that recovers from its bottom and is very likely to grow in the weeks to come.
Namaste.

CTSIUSDTHello Crypto Lovers,
Mars Signals team wishes you high profits.
This is a one-day-time frame analysis for CTSIUSDT
We see R2 that used to be a support area. R1 is our resistance areas which show the disability of the price in order to rise. S1 used to be a resistance line. And S2 and S3 are the support areas which contain the well support of price at different points. Hence, the price could break S1 upward and now it is fluctuating above it. We believe two options would happen when the price rises again to R1. Either we have some rising signs and an increase toward R2 or even higher than that is expected. Or the price may fall below R1 and might face more decline toward S2. We recommend you to obtain every piece of information and idea via our analyses for enjoying more profitable trades.
Warning: This is just a suggestion and we do not guarantee profits. We advise you to analyze the chart before opening any positions.
Wish you luck

CTSI looks like it wants to explode.Notice that the diagonal is also the support line of CTSI. I am expecting an explosion of it. Let's wait and see.

CTSI 6.12.22 It is a risky token because I do not know its project in detail. The levels I expect according to the current rise are as in the chart.
I believe it will reach $0.1433 unless 4h candles are closed below $0.13 levels. In case of a possible second pump, the levels I will look for short trades will be the $0.153 - $0.16 area. The fact that BTC maintains its current levels is enough for this scenario to happen.
What I write here serves as a note to myself. Does not include investment advice.

CTSI into the zone / CTSI do zónyEN: on CTSI, we could see a nice short right now.
I could see it looking into one of those zones and then a possible long.
I would definitely watch that and then possibly long.
CZ: na CTSI jsme mohli vidět teď krásný short.
Viděl bych to, že se podíváme do jedné z těch zón a pak možný long.
Určitě bych to sledoval a pak případně longoval.


#CTSIUSDT🚨Signal Type🚨: 🟢 LONG #CTSIUSDT
💫Leverage: Cross (5X - 20X)
🎪Entry Targets:- 0.1205-0.1212
🎯Profit Targets:
👑Tp1 :- 0.1230
👑Tp2:- 0.1260
👑Tp3:- 0.1290
👑Tp4:- 0.1310
👑Tp5:- 0.1340
❌Stop Targets: 0.1194
Signal by : 🇱🇰 @EshangaThejanBandara☎️

CTSIUSDT cup and handle formingin order for this play to happen
price must hold the 0.126-0.125 areas.
we are above the 200 ema in the 15 min 30 min 1 hourly charts so trend have a strong potential to stay bullish.
if price proves itself above the 0.126 bullish price action will be more likely
however if we start moving below it bearish continuation of the selling pressure is likely.
on the 1 hourly chart
bearish continuation will be (in my opinion) a breakdown below 0.1255
which would also be invalidate my bullish theory.
currently im long from 0.1260..
stop loss 0.1253
good luck to everyone

CTSIUSDT cup and handle formingHello traders.
CTSI on a critical structure level as of this moment.
we are on the 15 min chart and as you can see we are above the 200 EMA
and the trend line is bullish (bearish on 1 minute 3 minutes 5 minutes bullish on 15 minutes and above)
even tho we are under a high selling pressure
if we want to look for a BUY price MUST hold this level, breaking down any further could invalidate the structure.
For longs holding a 0.1255-0.1260 as support AND rising from it
for shorts
a breakdown below 0.1253 would indicate a breakdown in my opinion.
if we hold and have a buy, enormous gains can be made with this trend reversal/continuation pattern
good luck
im long.

Technical analysis for CTSIHigh buyers pressure and two touches of the level contribute to the probable upcoming breakout of the level. It is reasonable to find entry point for early loading before the breakout during deeper correction.

CTSIUSDTHello Crypto Lovers,
Mars Signals team wishes you high profits.
This is a 4-hour-time frame analysis for CTSIUSDT
Here we have R2 and R1 as our resistance areas which both contain the disability of the price to rise. And at the bottom you observe S1 that used to be a resistance line but now it is active in the role of a support line. Thus, we have the fluctuation of price below R1 area and our expectation would be a rise to the height of this area and there we should receive some confirmation candles to make sure what will happen exactly. Either the price will provide some rising signs and fluctuates over R1 and subsequently there is more rise for it upward to R2. Or it is possible that the price is not supported at R1 and starts a decline down to S1 or some other lower amounts. Let's wait for our updates and then decide more logically in your trades.
Warning: This is just a suggestion and we do not guarantee profits. We advise you to analyze the chart before opening any positions.
Wish you luck

#CTSI to 0,30$?Hello dear Traders,
Here is my idea for #CTSI
Price closed above yellow line (previous month high)
Price closed (15min Chart) above purple trigger line to enter trade.
Targets marked in the chart (black lines)
Invalidation level marked with red line
Good luck!
❤️Please feel free to ask any question in comments. I will try to answer all! Thank you.
Please, support my work with like, thank you!❤️

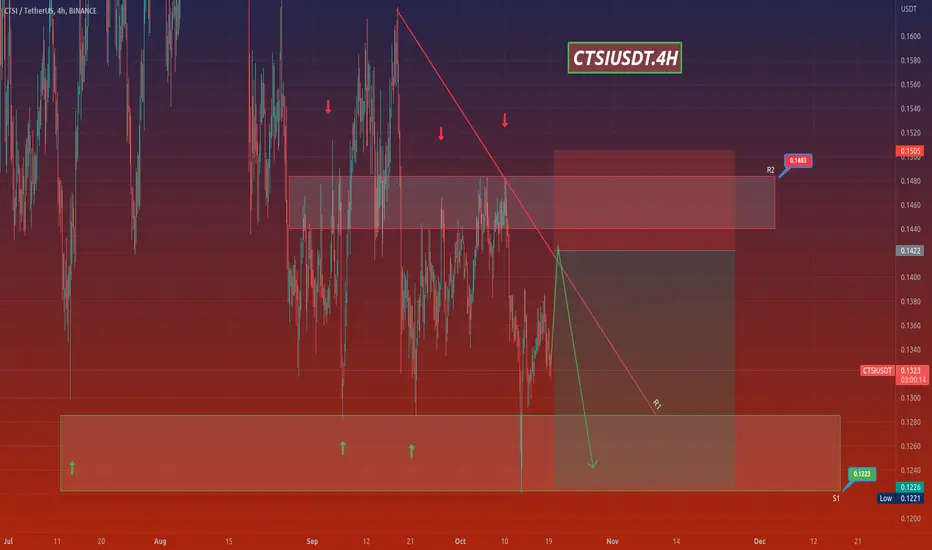
CTSIUSDTHello Crypto Lovers,
Mars Signals team wishes you high profits.
This is a 4-hour-time frame analysis for CTSIUSDT
You see that R2 and R1 are the resistance areas which express the disability of the price to rise. And S1 is our support area that includes the well support of price since the past. Hence, we have the fluctuation of price over S1 and we believe it will continue its rising trend toward R1. There we must wait for some falling signs and via receiving them, the short position of our chart is activated and a fall will be expected to happen down to S1. Let's wait and see what future will reveal for us. Please consider the confirmation candles in your trades for more logical actions.
Warning: This is just a suggestion and we do not guarantee profits. We advise you to analyze the chart before opening any positions.
Wish you luck
CTSI DAILY 101822Expecting a leg lower to finish wave C of 2 from this descending wave B correction. Not financial advice.

CTSI TA training chart
This is my Outlook for CTSI, two possible outcomes, orange option includes broadening the trend

CTSIUSDT Descending Triangle on Daily Chart.Setup for Long on CTSIUSDT using Descending Triangle Pattern.
There's a 5x Tested Support Holding at 0.12940, I see a rejection at 0.14600 taking place, Pushing Price downward to liquidate All the Longs at the 0.12940 Level. After Support Breaks we can 1. Long Lower low or 2. Wait for Confirmation from a Higher Low. Overall it's highly unlikely that we won't break the 5x repeated support imo.
Tp's at past major Resistances. Min R = 2R, Max R = 13R. (10% Initial Risk)


CTSIUSDT wants the breakout?The price had a clear breakout from the daily resistance and retest the Fibonacci level (0.618) as new support.
Now the price is trying to accumulate long position in order to have a clear breakout from the descending channel
How to approach it?
IF the price is going to have a breakout and retest the resistance as new support, According to Plancton's strategy , we can set a nice order
–––––
Keep in mind.
🟣 Purple structure -> Monthly structure.
🔴 Red structure -> Weekly structure.
🔵 Blue structure -> Daily structure.
🟡 Yellow structure -> 4h structure.
–––––
Follow the Shrimp 🦐

CTSIUSDTHello Crypto Lovers,
Mars Signals team wishes you high profits.
This is a 4-hour-time frame analysis for CTSIUSDT
Here we have R1 are the resistance line which shows the unsuccessful triumphs of the price in order to rise. S1 used to be a resistance line and S2 is our support line that represents the support of price. Currently, we see the fluctuation of price below R1 and we expect it will have a decline and then by receiving some confirmation candles to rise, an increase is there for it to R1 (which is good point for saving profits). Even the price may lose the support when it reaches S1 and surely more fall will happen to it toward S2.
Warning: This is just a suggestion and we do not guarantee profits. We advise you to analyze the chart before opening any positions.
Wish you luck

CTSIUSDT Price Reversing From Its Major Support ZoneCTSIUSDT Technical Analysis Update.
CTSI price revering from its major support zone.
Buy zone : $0.142- $0.149
Stop loss : $0.125
Target 1 : $0.165
Target 2 : $0.190
Target 3 : $0.246
Always keep stop loss
Thanks
Hexa
