CVCUSDT trade ideas
CIVIC- CVC future x2Medium term investment !
CIVIC somehow is ignored by a lot of people.
How we see, it has hit the bottom so I'm defensively buying here !
Now I'm waiting for BTC to recover so alts start to pump too.

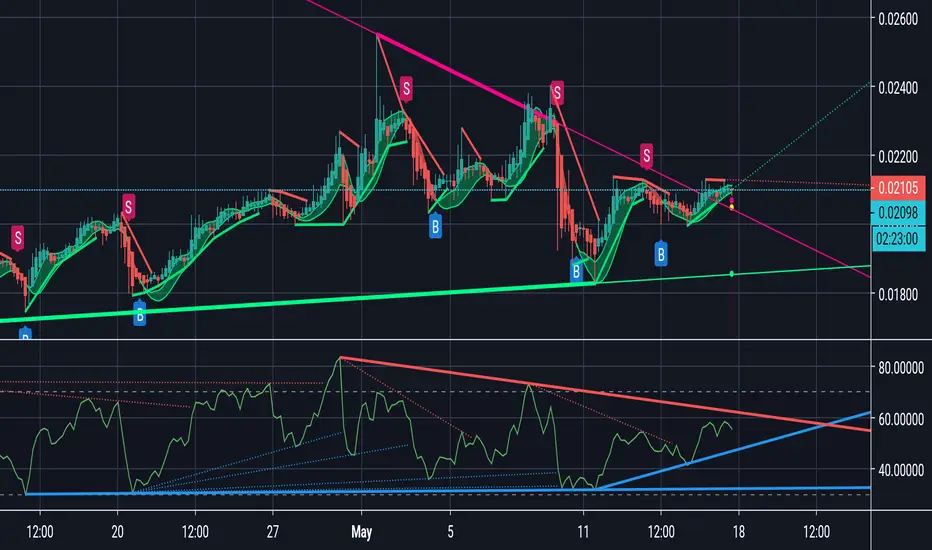
Nice volume + cup & handle. today!- Volume incoming nicely
- cup and handle
- sell at the green line.
///
Everyday i develop my own work philosophy.I wish to anyone to enjoy trading as i do.

CVCUSDT Trading the range.Setup was created a couple of days back. Nice profit potential.
I will keep update.

CVCUSDT formed bullish BAT | A good long opportunityPriceline of world's 173 ranked cryptocurrency Insolar Civic (CVC) has formed bullish BAT pattern and entered in potential reversal zone.
This PRZ area should be used as stop loss in case of complete candle stick closes below this zone.
Lets have a look on the move of price action to see how perfect this pattern is driven:
After initial leg (X to A) the A to B leg is retraced between 0.382 to 0.50 Fibonacci and then B to C leg is projected between 0.382 to 0.886 of A to B Fibonacci projection area and last leg (C to D) is retraced between 0.786 to 0.886 Fibonacci and now the price action is moving in potential reversal zone of this bullish BAT and now we can expect bullish divergence at any time which will lead the priceline between 0.382 to 0.786 Fibonacci projection of A to D leg , but if after this bullish divergence the candles sticks will be closed above the 0.786 Fibonacci projection area of A to D leg then it can also lead to the long term bullish move.
As per Fibonacci sequence method we can set our targets as below:
Buy between: $0.01922 to $0.01899
Sell between: $0.01976 to $0.01976
At this time the price action is moving above the PRZ area just wait for price correction and then try to buy within the potential reversal zone.
Regards,
Atif Akbar (moon333)
The harmonic moves analysis involves hours of hard work and determination however the success of harmonic trading in fiat and cryptocurrencies is around 80% therefore it is always important that you follow any stop loss strategy while trading harmonic patterns I have also shared a stop loss idea in this article, the information in this article is for educational purpose only this is not an investment advice, I have tried my best to catch the harmonic moves as per predefined classical harmonic BAT pattern if you find any flaw or you have any suggestion feel free to share with me in comments section.

CVC reversing at day TFCVC look pretty good at day timeframe, but 4 hours show it might pullback from current resistance zone it is testing now. So there are two scenarios. Either pullback, and then buy zone should be around 0.01825, or breakout to 0.02277, and than buy zone should be on pullback to current resistance 0.0208, that will become new support.
Targets for future growth: 0.0233 - 0.0255 - 0.0277

CVCUSDT formed bullish Butterfly | Upto 82% expectedPriceline of Civic / US Dollar has formed a bullish Butterfly pattern and entered in potential reversal zone.
Do use the potential reversal zone as stop loss in case a candle stick closes below this PRZ area.
I have defined targets using Fibonacci sequence as below:
Buy between: 0.02865 to 0.02343
Sell between: 0.03270 to 0.04251
Regards,
Atif Akbar (moon333)


CVC testingresistanceas shown in chart CVC/USDT is testing the resistance and wants to do outer pullback
but if it cant go through we expect to go down through the first (not weak and not strong) support

CVC Why you should be LONGGood day traders. I began scaling into CVC this morning around $0.075 because the 15 MA is crossing the 30 MA from below. The momentum is rising and positive. All this means its time to buy!
Green arrows indicate long opportunities and red arrows mean "you should have sold already"!
Simple but effective edge for alt coins but will give false signals so I set S/L around 0.06 (20% from average buy in).
Manage the trade once in profit and begin taking profits 0.09 but always split profits with coins...that way your never out of the trade (house money)
Back test for yourself and see how simple can be super effective. It's been my go to for awhile now and has produced sweet profits!
This is not financial advice or a recommendation to buy. Please do your own research and form your own opinion. Develop an edge and a trading plan, master them then you can add more...
