CVC/USDT📈SIGNAL
COIN : BINANCE:CVCUSDT
CEX. : #BINANCE - SPOT
➖
ENTRY : 0.1082
➖
TARGETS :
T1 : 0.1168
T2 : 0.1259
T3 : 0.1369
T4 : 0.1939
➖
STOP : 0.1022
➖
⚠️WARNING:
• I'm not a financial advisor.
• Do your own research (DYOR).
• And Don't forget risk management.
➖
💡For investors:
1- Enter the trade with 10% to 20% of your capital to reduce risk and save cash to enter other opportunities.
2- Sell (25% to 50%) on (T1) and don't move your stop-loss.
3- Sell 50% on (T2) and move your stop loss to the entry point.
4- You are safe now, and the next 25% is up to you.
5- Stop is activated. When one candle closes below the stop level of the same time frame of the signal.
➖
💡For intraday scalping:
1- Enter the trade with 10% to 20% of your capital to reduce risk and save cash to enter other opportunities.
2- You can close the trade at the first target.
3- Stop loss is direct without waiting for the candle to close.
➖
💡Reason for this trade:
BINANCE:CVCUSDT gives my trading system a sign of strength:
1. My trading system is based on liquidity and reversal zones.
2. When the liquidity is swept from one side under certain conditions, we will wait for the price on the other side.
The liquidity will attract the price like a magnet.
➖
• the first side that has been swept:
A- strong liquidty pool
B- reclaim valu area high
➖
• Opposite side targets:
A- equal high
B- FVG
C- liquidty void
➖
💡Entry setup
A- reclaim mid range + valu area high
CVCUSDT trade ideas


CVCUSDT(Civic) Daily tf Range Updated till 26-03-24CVCUSDT(Civic) Daily timeframe range. pretty good performance from this one. i had a position from 0.1923 played out very well. not much of pushback here at 0.3201 depend on swing sellers. gaining upperhand from 0.3201 can give it a good advantage.

Falling Wedge Pattern with Key Zones IdentifiedHello beautiful people,
Today, we are observing a potential bullish reversal setup in the CVCUSDT trading pair, primarily governed by the classic "Falling Wedge" pattern. Here are the important level to watch for:
The pair is trading within a distinct falling wedge pattern, which is typically perceived as a bullish reversal signal post a downtrend. The converging trendlines, both slanting downwards, are becoming closer, indicating a potential breakout soon.
There's a conspicuous area within our chart acting as a robust zone for long positions. This region, backed by historical data, indicates strong buying interest. Observing the volume can give further clarity on the accumulation.
Above our current trading level is the liquidation clearance zone, which may cause some resistance. This area is anticipated to have considerable selling activity, especially from traders who were previously short and might face liquidation as the price ascends.
For those considering an entry, a prudent stop-loss would be slightly below the lower trendline of the falling wedge or beneath our identified accumulation zone. Always remember to adjust stop-loss based on real-time data and risk appetite.
As always, perform your own due diligence and use appropriate risk management.
Happy trading!

CVC LOOKS BULLISHWe have had a large diametric that appears to be the end of the G wave of this diametric, which is itself a diamond diametric.
By maintaining the green range, it can move towards the targets.
Closing a daily candle below the invalidation level will violate the analysis.
The targets are clear on the chart.
For risk management, please don't forget stop loss and capital management
When we reach the first target, save some profit and then change the stop to entry
Comment if you have any questions
Thank You

Bullish trend to fill the gapAccording to my analysis, we have just witnessed a sweep. To continue the bullish trend, get ready to go TO THE MOON to reach 0.3.

CVC on the moveWith formidable volume and two buy prints I expect more profits
Next stop 0.20 and above
DYOR

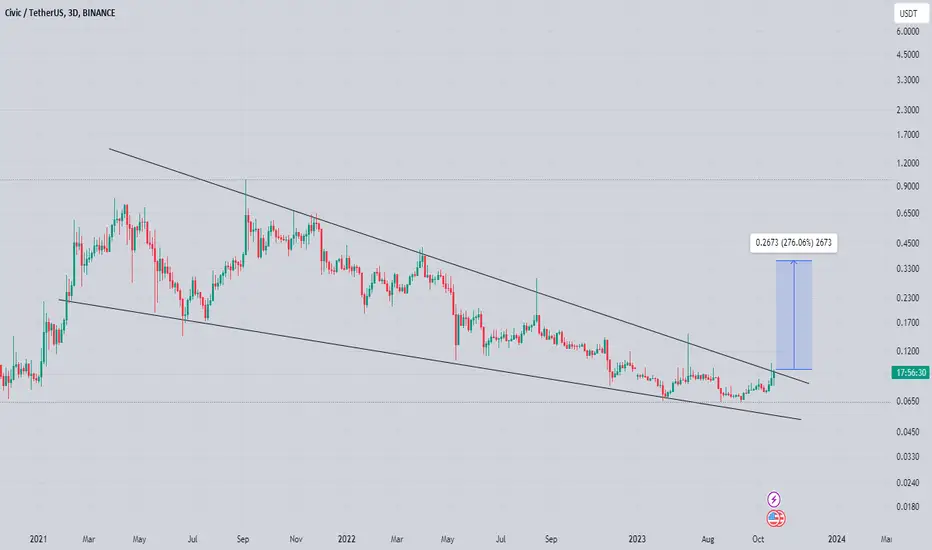
cvc on verge of massive breakout on verge of massive breakout and getting ready for solid recovery in midterm
formed falling wedge in 3 days tf and testing descending trendline expecting massive breakout soon incase of successful breakout expecting 200 to 220% bullish rally
CVC ANALYSIS (12H TF)We are in a large diametric, and the E wave of this diametric itself has become another diamond diametric, which we discussed on the chart.
We expect to have a bottom for the g wave of E after the f wave of E is completed. The green area is a strong support area where we look for buy/long trades.
For risk management, please don't forget stop loss and capital management
Comment if you have any questions
Thank You

CVC can pump 30% if breakout 0.099it needs to breakout the resistance at 0.099 to reach the target 30%

CVV/USDT Unveiling Opportunities: Analysis of CVV/USDT Spot Pair at Daily Chart-Time
The CVV/USDT spot pair has been experiencing a bull market over the past few months. A bull market is characterized by a sustained upward trend in prices, driven by increasing investor optimism and buying pressure. Traders looking to take advantage of this trend may consider opening long positions, which involve buying an asset with the expectation that its price will rise.
In contrast, a bear market is marked by a downward trend in prices, fueled by pessimism and selling pressure. Traders anticipating a bearish move may opt for short positions, where they sell an asset they don't own in the hopes of buying it back at a lower price later.
When analyzing the CVV/USDT pair, it's essential to identify key support and resistance levels. Support refers to a price level where demand is strong enough to prevent further declines, while resistance represents a price level where supply is abundant, preventing upward movements. These levels help traders make informed decisions about entry and exit points.
Moving averages, such as the exponential moving average (EMA), are useful tools for identifying trends and potential reversal points. They smooth out price data over a specified period, providing a clearer picture of the overall direction. Additionally, the Relative Strength Index (RSI) helps gauge the strength of a trend and determine whether an asset is overbought or oversold.
Fibonacci levels and Fibonacci retracement are commonly used in technical analysis to identify potential support and resistance levels based on the Fibonacci sequence. These levels are derived from ratios that are believed to have relevance in the natural world and can serve as significant price levels where buying or selling pressure may increase.
Volume and volume profile play crucial roles in analyzing market activity. Volume refers to the number of shares or contracts traded in a given period, indicating the level of participation and liquidity in the market. Volume profile, on the other hand, provides a visual representation of the volume at different price levels, helping traders identify areas of high or low liquidity.
Breakouts occur when an asset's price moves above a significant resistance level or below a key support level. Breakouts often lead to increased volatility and can present trading opportunities for those looking to capitalize on potential price momentum.
Higher highs and higher lows are characteristic of an uptrend, indicating a series of price movements where each subsequent peak and trough is higher than the previous one. This pattern suggests continued strength in the market and reinforces the bullish sentiment.
Trendlines are lines drawn on a chart that connect significant highs or lows, providing visual representations of the prevailing trend. These trendlines help traders identify potential areas of support or resistance and can be used as reference points for decision-making.
Support levels are price levels where buying pressure is expected to be strong enough to prevent a further decline. Traders often look for these levels as potential entry points, anticipating a bounce in price.
Volatility refers to the degree of variation in an asset's price over a given period. Higher volatility can present increased trading opportunities but also carries higher risk. Traders should consider volatility levels when formulating their strategies and adjusting position sizes accordingly.
Liquidity refers to the ease with which an asset can be bought or sold without causing significant price changes. High liquidity ensures that traders can enter and exit positions with minimal slippage, while low liquidity can result in wider bid-ask spreads and potential difficulties in executing trades.
By considering these terms and conducting a thorough analysis of the CVV/USDT spot pair at the daily chart-time, traders can make more informed decisions, identify potential trading opportunities, and manage risk effectively.

CVCUSDT CVCUSDT is trading in consolidation box and seems like it will break through the box. As it already break the declining trendline. If the instrument close above 0.0750 , it will be a good buying option.


CVC/USDT possible Double Bottom Hey, guys ✌️
Another coin that caught our attention is CVC coin. Well as you can see a possible double bottom is forming here which is a good chance for bullish movement here towards neckline zone. As always red zone is marked as buy zone and green as target.
If you like ideas provided by our team you can show us your support by liking and commenting.
Yours Sincerely,
Swallow Team 🔱
Disclamer:
We are not financial advisors. The content that we share on this website are for educational purposes and are our own personal opinions.

CVC/USDT do you see what we see? Hey brother and sisters
Last one for today is going to be CVC coin. So we think we all see the pattern that has formed on this coin. What do you think guys? will it touch that neckline zone or not?
If you like ideas provided by our team you can show us your support by liking and commenting.
Yours Sincerely,
Swallow Team 🔱
Disclamer:
We are not financial advisors. The content that we share on this website are for educational purposes and are our own personal opinions.

CVC/USDT broke the neckline! Hey guys
Another one that caught our attention was CVC coin here. Well we detected a Double Bottom pattern which worked just fine and broke that neckline zone thanks to CPI data which was released today. So now we see a good possibility for a long position here - but bear in mind that tmrw there is going to be FOMC meeting...intense week what we can say.
If you like ideas provided by our team you can show us your support by liking and commenting.
Yours Sincerely,
Swallow Team 🔱
Disclamer:
We are not financial advisors. The content that we share on this website are for educational purposes and are our own personal opinions.

CVC/USDT waiting for entry! Hey, traders
So let's take a quick look at CVC coin. We see a good possibility for scalp short position here but only after we reach that upper line which is going to be our first target for now! After that we would open some sell positions!! What do you think?
If you like ideas provided by our team you can show us your support by liking and commenting.
Yours Sincerely,
Swallow Team 🔱
Disclamer:
We are not financial advisors. The content that we share on this website are for educational purposes and are our own personal opinions.

CVC/USDT Let's leave that downtrendMorning colleagues!
CVC/USDT is last coin to watch for us today. Will keep it short, Downtrend is still in progress but we see that soon we should move out of this zone and that might be on upcoming days. What do you think guys?
If you like ideas provided by our team you can show us your support by liking and commenting.
Yours Sincerely,
Swallow Team 🔱
Disclamer:
We are not financial advisors. The content that we share on this website are for educational purposes and are our own personal opinions.


CVC/USDT looks bullish to us Morning colleagues!
Last coin for today is going to be CVC. There is not much to say at the moment, all we can do is wait for a 2 green candles on 1D chart for a confirmation and until that we will be just watching this coin. What are your thoughts?
If you like ideas provided by our team you can show us your support by liking and commenting.
Yours Sincerely,
Swallow Team 🔱
Disclamer:
We are not financial advisors. The content that we share on this website are for educational purposes and are our own personal opinions.

CVC/USDTCVC has broken above the falling channel and looking for upside move,where the next resistance is at yellow box area.Breakout above this yellow box area will be huge for CVC holders.

CVC/USDT Down TrendPossible bearish price movement towards the support 0.1182 within the next 8 hours.

CVC/USDT getting ready!Morning colleagues!
Last coin for today is going to be CVC. From the last time we have had a nice profits from our trades as CVC moved just as we wanted it to move. But new week new trades and opportunities so we see a three possible scenarios for this coin - We have marked buy zone and sell zone so we are ready for both ways! This looks great setup for us and we will take actions only once we get confirmation of our direction!
If you like ideas provided by our team you can show us your support by liking and commenting.
Yours Sincerely,
Swallow Team 🔱
Disclamer:
We are not financial advisors. The content that we share on this website are for educational purposes and are our own personal opinions.
