CVC can tests previous highs and break up to the universe This is not a financial advice. Always do your own research and always put stoploss in your trade (SL) :) If you want more detailed info how to study and read charts or just need help with some coin, just write to me here personal message, i will try to answer to everybody... i can help you :) all for free, don't worry, BE HAPPY!
If u like the analysis, please feel free to ask any question about this TA or crypto or any coin and also leave a comment or like, i really appreciate it because then my work makes sense :) thanks!
CVCUSDT trade ideas


CVCUSDT long Risk warning, disclaimer: the above is a personal market judgment based on published information and historical chart data on Tradingview, all analysis is only subjective. Hope investors consider, I am not responsible for your investment decision. Thank you.
Good luck!


CVCCHART, Originally fractal problem. First year projectThis is CVC's first Bullrun. I made a fractal for it.
Coin prediction has been to been seen to be Currently on its way up to 0.80. Lets just give this a target all the way to $4.00(Just because I feel like I have seen this number, however I will make this chart up to $0.80. The create a fractal afterwords. Wanted to publish as fast as possible. Not financial Advice!

🔥 CVC Path To New All Time HighCVC has formed a new all time high last week. Since then, a small correction has been going on, which has now concluded.
Since today CVC is seeing small 4H candles, indicating that early buyers are flocking in and pushing the price higher. Like we have seen with a lot of other crypto's, small bullish bars are often leading to later exponential growth. In case of the latter, we could expect a new all time high soon.
On the chart I’ve marked two potential areas of resistance, R1 and R2. These areas are based on recent swing highs and round numbers. Do your own due diligence.
Happy trading!

civic chart updatemy all previous cvc targets were hit. cvc is good project with good team new targets on chart
not FINANCIAL ADVICE
#DYOR

UPDATE ON CVC we held very well with btc then pulling back , i really feel we wil continue to rise , we just need to get over that 21ma which is also the resistance on the rsi 50 mark

Symetrical triangle bullish ideahi all , another idea here, as u can see its a clear pattern and is respecting it, its a clear buy signal at the bottom but be sure to use a stop loss in case it falls lower, but i really think we will bounce and go up from there,
be sure to like :}

CVCUSDT BREAKOUT!Breakout of continuation pattern! RSI above 50, bounce off the 50 Fibonacci, and price above the 20 EMA. Good luck!

CVCUSDT LONGBreakout after forming another funnel here looks pretty bullish setup here for new highs


🔥 CVC/USDT Bullish Triangle Almost CompleteSince the early days of 2021 CVC has been residing inside a bullish triangle. I'm aware that there are some spikes here and there, but the general structure of the triangle remains intact.
Before entering this trade I strongly advise waiting until the upper resistance of the triangle has been broken on a higher time frame. If you're feeling confident about CVC being bullish you can enter already now.
On the chart, I’ve marked two potential areas of resistance, R1 and R2. These areas are based on recent swing highs and round numbers. Do your own due diligence.
Happy trading!

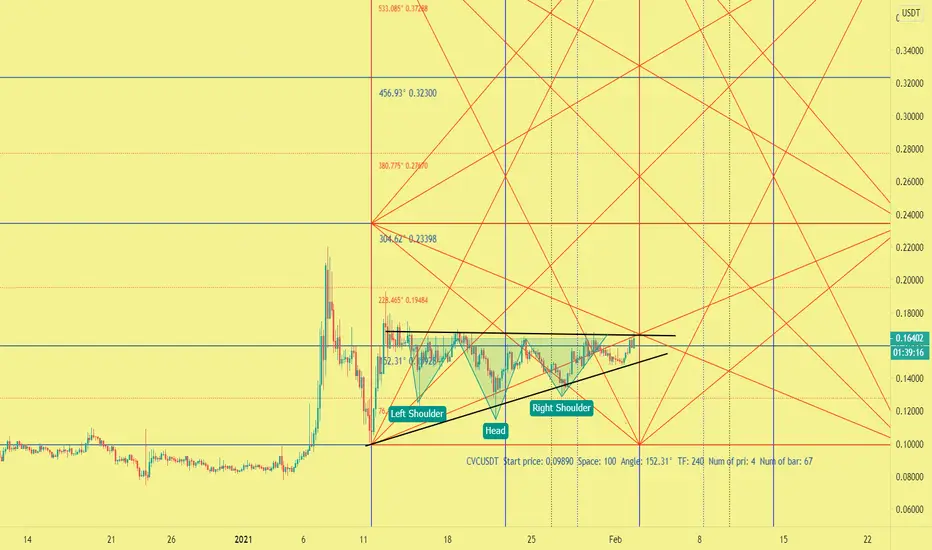
Pending further modificationAccording to the chart, expect the fall to be below the support (red line), then return to the two resistors specified in the chart


CVC USDT 4H CVC BULLISH
IT ALREADY BROKE THE TRIANGLE
BUY AFTER 4H CHART CLOSE ABOVE THE TRIANGLE::::
TARGETS ON CHART ::::

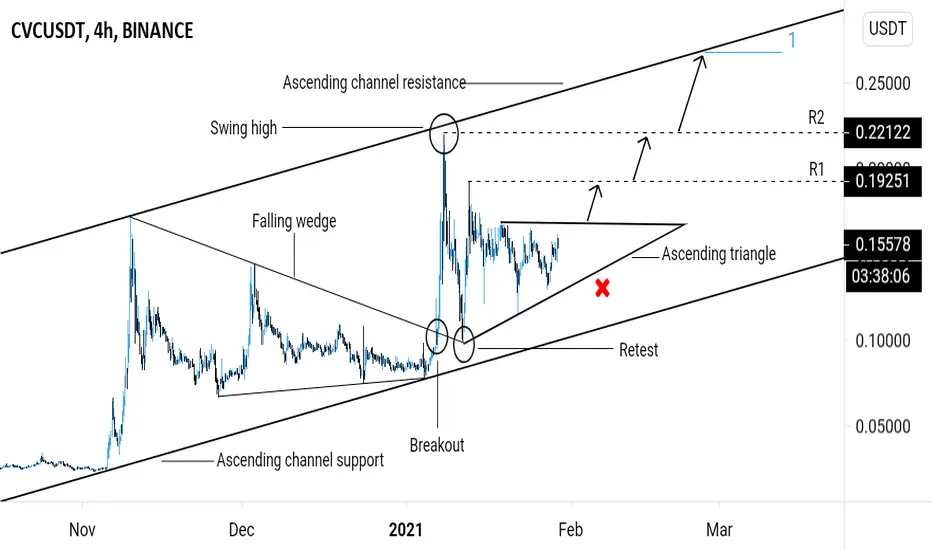
CVCUSDT (CVC) - UPTREND CONTINUATION ANALYSIS 🔎
- CVCUSDT bounced off the ascending channel support, breakout out above the falling wedge's resistance.
- CVCUSDT hit a swing high and retraced.
- Price retested the falling wedge's resistance.
- Price action is printing an ascending triangle pattern.
- Price is testing the ascending triangle's horizontal resistance.
- Breakout above the ascending triangle's horizontal resistance could be an uptrend continuation signal.
BUY ENTRY ⬆️
- Breakout above the ascending triangle's horizontal resistance.
TARGETS 🎯
- Horizontal resistance levels (R1, R2).
- Fibonacci extension levels.
- Ascending channel resistance.
SETUP INVALIDATION ❌
- Breakdown below the ascending triangle's inclined support.