CVX Bullish DivergenceBINANCE:CVXUSDT
Trade Setup:
Target 1: 4.812 (0.786 Fibonnaci Golden Zone).
Target 2: 5.121 (0.618 Fibonnaci Golden Zone).
Target 3: 5.338 (0.5 Fibonnaci Golden Zone).
Target 4: 6.257 (0 Fibonnaci).
Stop Loss: 3.919 (above recent high, ~25% above current price).
RSI Analysis: The RSI is showing

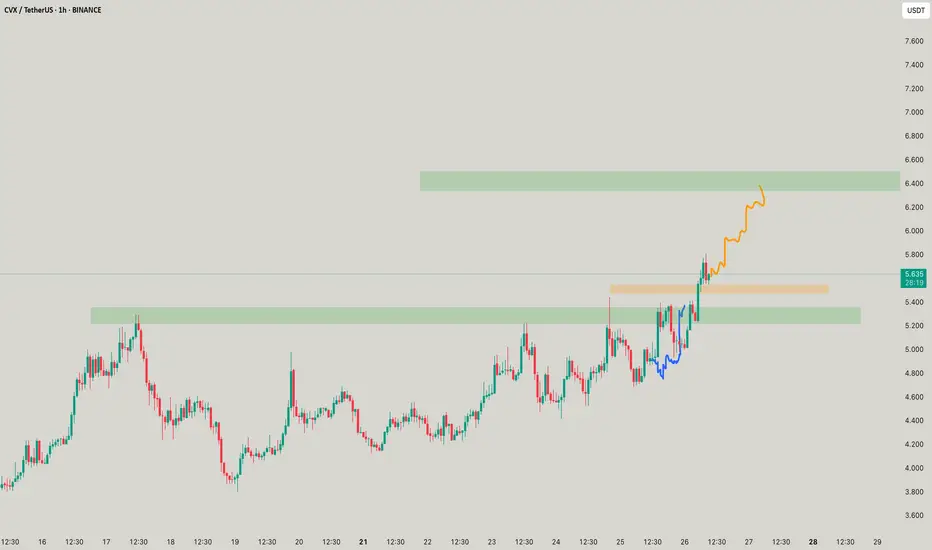
CVX - Get your civix straight again!CVX i posted, did went but wasn't powerful! Now the prowess says it if moves to the red, big moves can come up in a better ways! you can expect

CVX - It asks for you to be civic!SO 6.5 ! when? soon? soon when? if it doesnt breaks the orange, though looks ripe to get the orange one
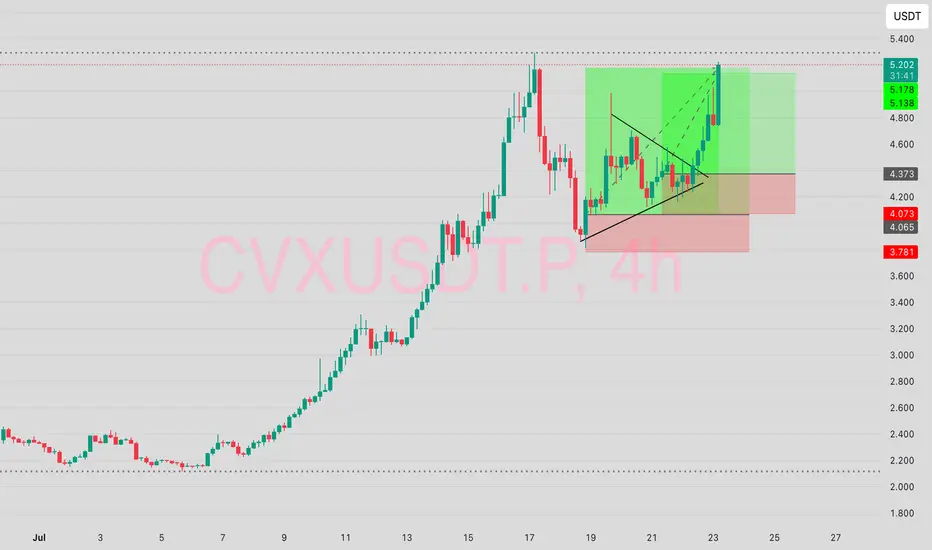
$CVX LONGHere’s what it means to have a conviction play.
This trade BYBIT:CVXUSDT.P got me glued.
went into the initial trade which went well but reversed, didn’t go out, I saw another entry and went in again.
It's a double TP in one trade. CONVICTION!!!
Buy Trade Strategy for CVX: Tapping into DeFi Yield OptimizationDescription:
This trading idea highlights CVX, the native token of Convex Finance, a key player in the DeFi ecosystem focused on optimizing yield farming within the Curve Finance protocol. CVX allows users to earn boosted rewards without locking their tokens directly into Curve, making it highly at
CVX/USDT – Is the scenario repeating? Continuing to work.The previous trading idea has played out with 3 out of 4 marked zones reached.
We saw a false breakout from the descending channel, followed by a pullback in line with the overall market—returning to the channel’s support zone.
I’ve noticed a potential formation of either a diamond pattern or an e
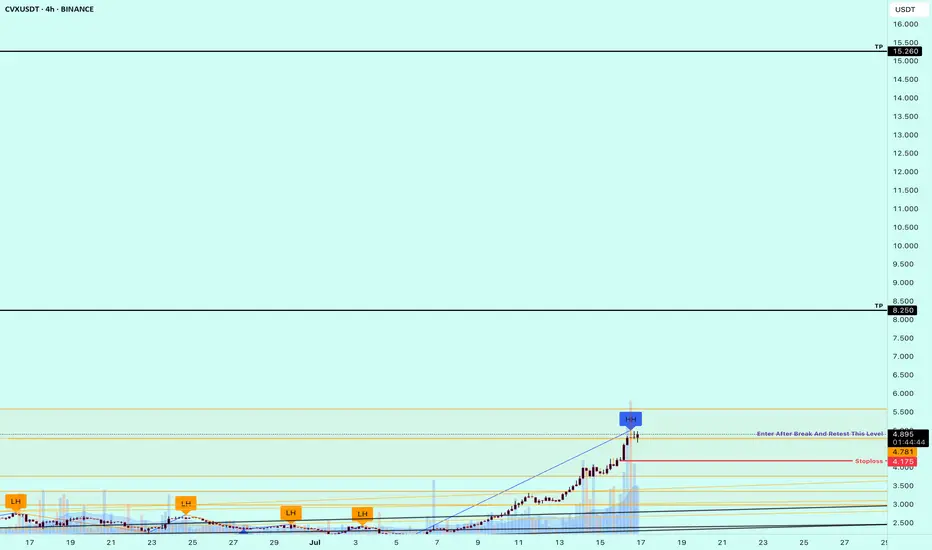
CVXUSDT - Buy CALL market is making series of HH and HL. market has taken corrective move uptil 0.382 of Fib Level, we shall take entry on break of HH and SL will be placed beneath the HL after being formed.
R:R of 1:1 and 1:2

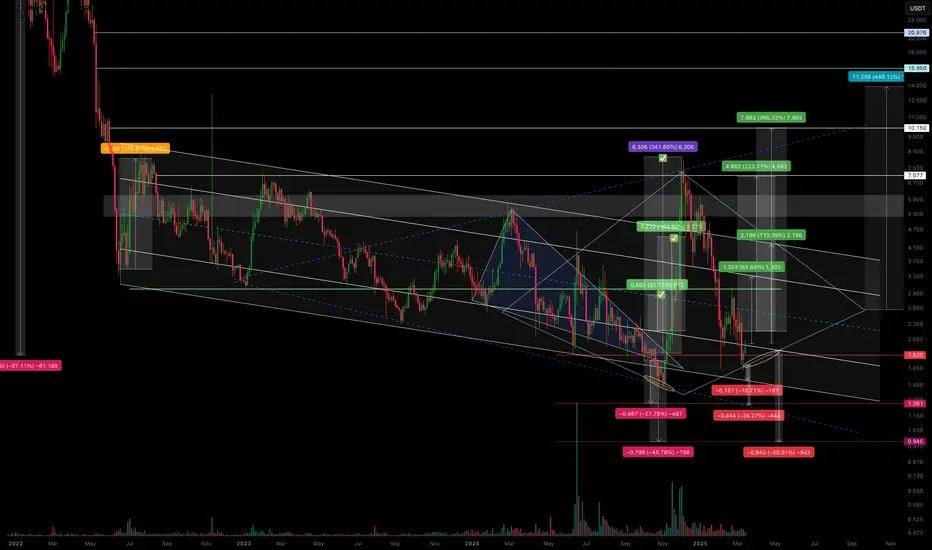
CVX/USDT Weekly Analysis — Strong Reversal Zone CouldTechnical Analysis:
1. Strong Demand Zone (Key Reversal Area)
CVX price has repeatedly tested a strong support zone around $1.43 – $2.20 (highlighted in yellow). This area has acted as a major accumulation zone, showing strong buyer interest and serving as a critical base support.
2. Potential Dou

#CVX best zone for make some money SOON ?#CVX
The price is moving within a descending channel on the 1-hour frame, adhering well to it, and is heading for a strong breakout and retest.
We are experiencing a bounce from the lower boundary of the descending channel. This support is at 2.30.
We have a downtrend on the RSI indicator that is

#CVX/USDT#CVX
The price is moving within a descending channel on the 1-hour frame, adhering well to it, and is heading towards a strong breakout and retest.
We are experiencing a rebound from the lower boundary of the descending channel, which is support at 2.644.
We are experiencing a downtrend on the RSI

See all ideas
Summarizing what the indicators are suggesting.
Oscillators
Neutral
SellBuy
Strong sellStrong buy
Strong sellSellNeutralBuyStrong buy
Oscillators
Neutral
SellBuy
Strong sellStrong buy
Strong sellSellNeutralBuyStrong buy
Summary
Neutral
SellBuy
Strong sellStrong buy
Strong sellSellNeutralBuyStrong buy
Summary
Neutral
SellBuy
Strong sellStrong buy
Strong sellSellNeutralBuyStrong buy
Summary
Neutral
SellBuy
Strong sellStrong buy
Strong sellSellNeutralBuyStrong buy
Moving Averages
Neutral
SellBuy
Strong sellStrong buy
Strong sellSellNeutralBuyStrong buy
Moving Averages
Neutral
SellBuy
Strong sellStrong buy
Strong sellSellNeutralBuyStrong buy
Displays a symbol's price movements over previous years to identify recurring trends.