CVX Bullish DivergenceBINANCE:CVXUSDT
Trade Setup:
Target 1: 4.812 (0.786 Fibonnaci Golden Zone).
Target 2: 5.121 (0.618 Fibonnaci Golden Zone).
Target 3: 5.338 (0.5 Fibonnaci Golden Zone).
Target 4: 6.257 (0 Fibonnaci).
Stop Loss: 3.919 (above recent high, ~25% above current price).
RSI Analysis: The RSI is showing a bullish divergence, suggesting potential bullish momentum. The current RSI is around 11.86, approaching oversold territory, so caution is advised.
CVXUSDT trade ideas

CVX/USDT: Long-Term Breakout Signals Massive Upside PotentialFirstly, our Algo-based indicators are used to create this analysis: DON'T MISS US. FOLLOW US, COMMENT AND BOOST.
This weekly chart for CVX/USDT reveals a major bullish breakout from a long-term pattern, suggesting that the asset may be in the early stages of a significant new uptrend.
Analysis:
Descending Channel Breakout: For over two years, CVX has been trading within a clear descending channel. Recently, the price has decisively broken out of this channel to the upside, signaling a major shift from a bearish to a bullish market structure.
Pullback and Reentry: Following the initial powerful breakout, the price executed a healthy pullback. It found support right around the key 50% Fibonacci retracement level (approximately $4.262). The chart notes this area as a potential "REENTRY" point, especially with the formation of a "W-Pattern" (double bottom) on a smaller timeframe, which is a classic bullish reversal signal.
Confirmation Indicators:
The Innotrade MC Signal indicator at the bottom shows multiple "BUY" signals in the recent accumulation zone and the indicator line is now trending upwards, suggesting building momentum.
The RSI status confirms a "Bull Trend" on the daily and weekly timeframes, supporting a long-term bullish outlook.
Price Targets: Based on Fibonacci extension levels from the recent major swing, several targets are identified:
TP 1: $12.243 (aligns with the 127.20% extension and a previous key resistance level).
TP 2: $19.726 (aligns with the 161.80% extension).
Long-Term Projection: The aggressive black line projects a potential move towards the 2022 highs, indicating massive long-term potential if the bullish momentum continues.
Strategy:
Position: Long (Buy)
Entry: The current price level around $4.30 - $5.00 is highlighted as a strategic reentry zone following the successful pullback.
Targets: The primary targets are
12.243
∗
∗
a
n
d
∗
∗
12.243∗∗and∗∗
19.726.
Conclusion:
The breakout from a multi-year descending channel, combined with a successful retest of key support and confirming indicator signals, presents a compelling long-term bullish case for CVX. The current price level offers a strategic entry for a potential multi-hundred percent move towards the identified price targets.
Disclaimer: This analysis is for educational purposes only and should not be considered financial advice. Always conduct your own research and manage risk appropriately.

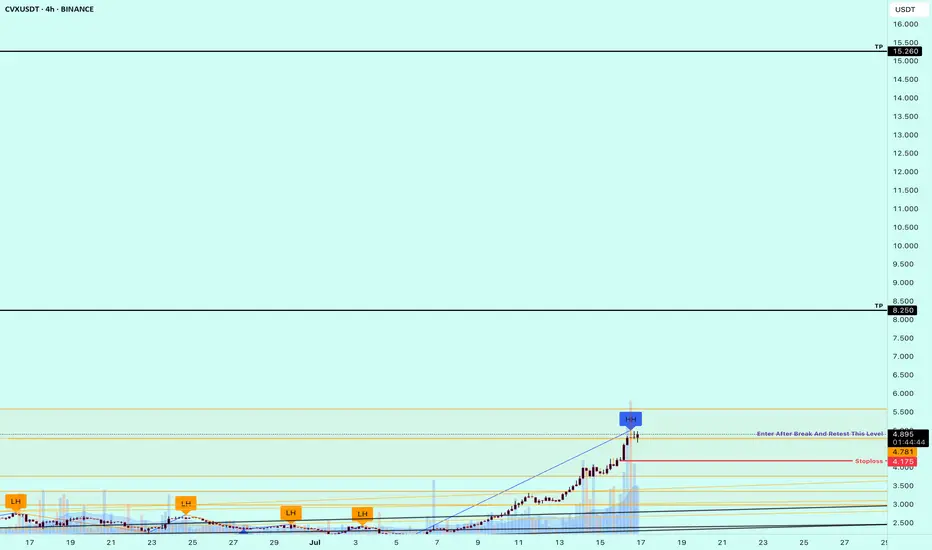
CVX - Get your civix straight again!CVX i posted, did went but wasn't powerful! Now the prowess says it if moves to the red, big moves can come up in a better ways! you can expect

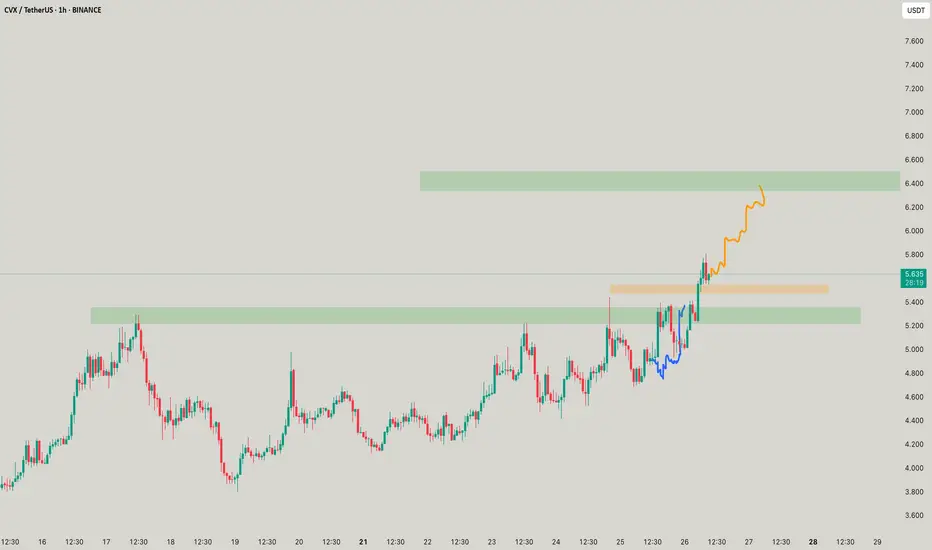
CVX - It asks for you to be civic!SO 6.5 ! when? soon? soon when? if it doesnt breaks the orange, though looks ripe to get the orange one
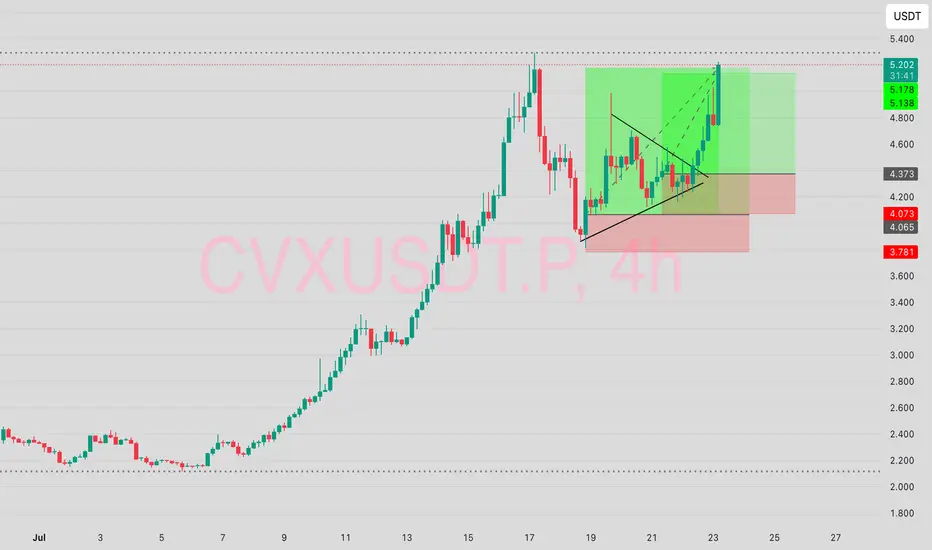
$CVX LONGHere’s what it means to have a conviction play.
This trade BYBIT:CVXUSDT.P got me glued.
went into the initial trade which went well but reversed, didn’t go out, I saw another entry and went in again.
It's a double TP in one trade. CONVICTION!!!
Buy Trade Strategy for CVX: Tapping into DeFi Yield OptimizationDescription:
This trading idea highlights CVX, the native token of Convex Finance, a key player in the DeFi ecosystem focused on optimizing yield farming within the Curve Finance protocol. CVX allows users to earn boosted rewards without locking their tokens directly into Curve, making it highly attractive for liquidity providers and yield seekers. With its growing influence over Curve’s governance and incentives, CVX has become a strategic asset in the DeFi landscape. As institutional interest and on-chain liquidity continue to grow, Convex's role in yield aggregation strengthens, potentially increasing demand for CVX.
Despite the strong fundamentals, the cryptocurrency market is unpredictable and susceptible to various external risks, including regulatory shifts, smart contract vulnerabilities, and overall market sentiment. Like all digital assets, CVX investments require careful consideration of both potential rewards and risks.
Disclaimer:
This trading idea is for educational purposes only and should not be interpreted as financial advice. Trading cryptocurrencies, including CVX, involves substantial risk and could result in the loss of your entire investment. Always do your own research, evaluate your financial situation, and consult with a licensed financial advisor before making any investment decisions. Past performance is not indicative of future results.
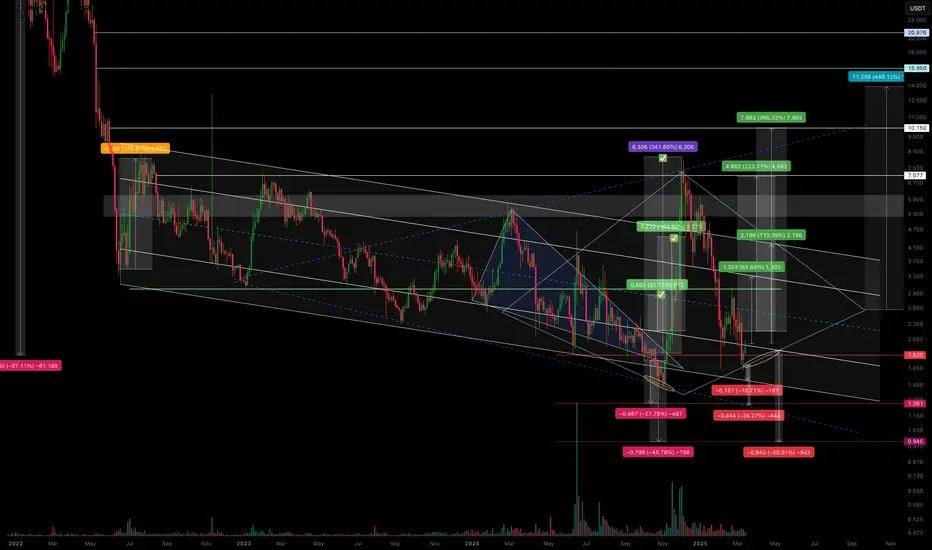
CVX/USDT – Is the scenario repeating? Continuing to work.The previous trading idea has played out with 3 out of 4 marked zones reached.
We saw a false breakout from the descending channel, followed by a pullback in line with the overall market—returning to the channel’s support zone.
I’ve noticed a potential formation of either a diamond pattern or an expanding triangle, but we’ll see how it plays out further.
Regarding declines and support zones:
-10.71% drop to the support of the descending channel.
-26.27% drop to the anticipated support of the expanding triangle.
-50% drop, likely as a squeeze under extremely negative news.
Regarding growth and resistance zones:
+65% rise to the resistance of the internal channel.
+110% rise to the resistance of the external channel (and if a diamond pattern forms, then its boundary).
+246% rise as a second attempt to break out of the descending channel.
+440% rise as a potential realization of diamond pattern pricing (if it forms).
All of this should be factored into your trading strategy, even the less likely scenarios.
I'll share the execution of the previous trading idea in my TG. I've also marked it on the chart.
CVXUSDT - Buy CALL market is making series of HH and HL. market has taken corrective move uptil 0.382 of Fib Level, we shall take entry on break of HH and SL will be placed beneath the HL after being formed.
R:R of 1:1 and 1:2

CVX/USDT Weekly Analysis — Strong Reversal Zone CouldTechnical Analysis:
1. Strong Demand Zone (Key Reversal Area)
CVX price has repeatedly tested a strong support zone around $1.43 – $2.20 (highlighted in yellow). This area has acted as a major accumulation zone, showing strong buyer interest and serving as a critical base support.
2. Potential Double Bottom Formation (Bullish Reversal Pattern)
A potential Double Bottom or Adam & Eve pattern is forming within this demand zone — a classic bullish reversal structure, indicating a possible trend shift to the upside.
3. Key Resistance Levels (Bullish Targets):
$2.90 – Minor resistance, likely to be tested in the short term.
$3.46 – Significant psychological and technical resistance.
$4.98 – Major resistance and neckline of the double bottom pattern.
$6.76 – Strong weekly resistance, a potential medium-term target.
$15.77 & $47.97 – Long-term targets if a macro bullish trend emerges.
Bullish Scenario:
If the price holds above the $2.20 support zone:
Gradual upward movement expected toward $2.90 → $3.46 → $4.98.
A confirmed breakout above $4.98 could trigger a rally toward $6.76.
Full bullish confirmation would occur if the price breaks and holds above $6.76, indicating a longer-term trend reversal.
Bearish Scenario:
If price breaks down below the $1.43 support level with a weekly close:
The double bottom structure would be invalidated.
Price could enter new price discovery territory, potentially heading below $1.00.
Market sentiment would turn significantly bearish.
Strategic Conclusion:
CVX/USDT is currently at a critical decision point. A strong historical support zone suggests a high potential for bullish reversal. Confirmation of the bullish structure requires a breakout above $4.98. However, caution is needed if price breaks below $1.43, as it may indicate structural failure.
#CVXUSDT #ConvexFinance #CryptoAnalysis #DoubleBottom #ReversalPattern #BullishSetup #AltcoinAnalysis #SupportResistance #CryptoBreakout #TechnicalAnalysis

#CVX best zone for make some money SOON ?#CVX
The price is moving within a descending channel on the 1-hour frame, adhering well to it, and is heading for a strong breakout and retest.
We are experiencing a bounce from the lower boundary of the descending channel. This support is at 2.30.
We have a downtrend on the RSI indicator that is about to be broken and retested, supporting the upside.
There is a major support area in green at 2.23, which represents a strong basis for the upside.
Don't forget a simple thing: ease and capital.
When you reach the first target, save some money and then change your stop-loss order to an entry order.
For inquiries, please leave a comment.
We are in a consolidation trend above the 100 Moving Average.
Entry price: 2.41
First target: 2.46
Second target: 2.55
Third target: 2.65
Don't forget a simple thing: ease and capital.
When you reach your first target, save some money and then change your stop-loss order to an entry order.
For inquiries, please leave a comment.
Thank you.

#CVX/USDT#CVX
The price is moving within a descending channel on the 1-hour frame, adhering well to it, and is heading towards a strong breakout and retest.
We are experiencing a rebound from the lower boundary of the descending channel, which is support at 2.644.
We are experiencing a downtrend on the RSI indicator that is about to be broken and retested, supporting the upward trend.
We are heading towards stability above the 100 Moving Average.
Entry price: 2.730
First target: 2.800
Second target: 2.860
Third target: 2.924

CVX LONG SETUP ALL trading ideas have entry point + stop loss + take profit + Risk level.
hello Traders, here is the full analysis for this pair, let me know in the comment section below if you have any questions, the entry will be taken only if all rules of the strategies will be satisfied. I suggest you keep this pair on your watchlist and see if the rules of your strategy are satisfied. Please also refer to the Important Risk Notice linked below.
Disclaimer


#CVX/USDT#CVX
The price is moving within a descending channel on the 1-hour frame, adhering well to it, and is heading for a strong breakout and retest.
We are seeing a bounce from the lower boundary of the descending channel, which is support at 2.97.
We have a downtrend on the RSI indicator that is about to break and retest, supporting the upward trend.
We are looking for stability above the 100 Moving Average.
Entry price: 3.30
First target: 3.43
Second target: 3.59
Third target: 3.77

Trading impulse moves counter CPR BiasTrading impulse moves counter CPR Bias. Talking Entry - SL POI

CVXUSDT 1D AnalysisCVX ~ 1D Analysis
#CVX Buy back on retest of this support block with short term target of at least 10%+ from here.
#CVX/USDT#CVX
The price is moving within a descending channel on the 1-hour frame and is expected to break and continue upward.
We have a trend to stabilize above the 100 moving average once again.
We have a downtrend on the RSI indicator, which supports the upward move by breaking it upward.
We have a support area at the lower limit of the channel at 3.00, which acts as strong support from which the price can rebound.
Entry price: 3.14
First target: 3.26
Second target: 3.42
Third target: 3.58

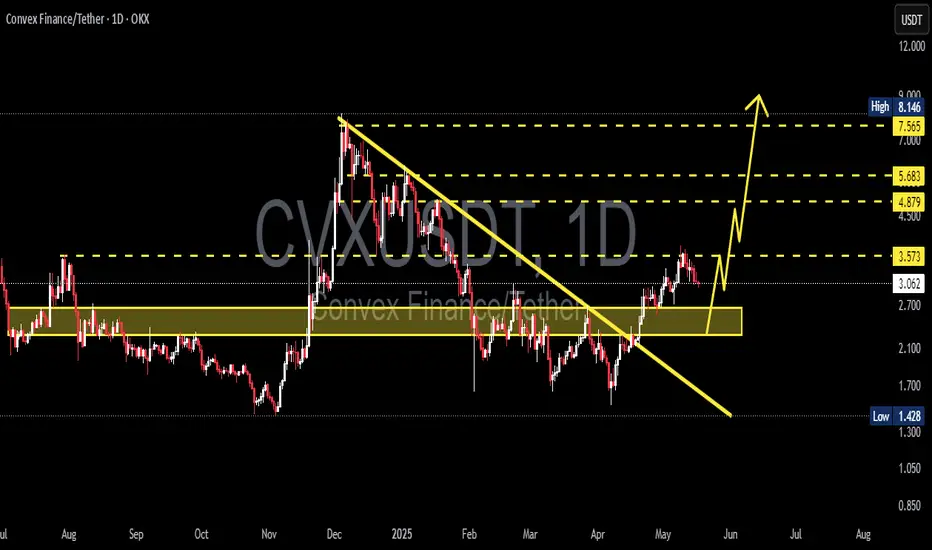
Convex Finance (CVX) Rectangle (1W)BINANCE:CVXUSDT has been trading in a rectangle with well-defined boundaries since January 2023, and it has recently reclaimed the 1-year EMA, potentially shifting the bias to bullish.
Key Levels to Watch
• $1.5-$2.0: Main demand zone and invalidation point for any bullish TA if broken
• $3.0: 1-year EMA, successfully reclaimed and retested as support
• $4.4: Rectangle midline, previously relevant as a S/R
• $6.1-$7.2: Main supply zone and upper boundary of the rectangle
• $13.0: Previous swing high and rectangle breakout target, which would be confirmed by a weekly close above $7.2 with good volume

#CVX/USDT#CVX
The price is moving within a descending channel on the 1-hour frame, adhering well to it, and is heading for a strong breakout and retest.
We are seeing a bounce from the lower boundary of the descending channel, which is support at 2.98.
We have a downtrend on the RSI indicator that is about to break and retest, supporting the upward trend.
We are looking for stability above the 100 Moving Average.
Entry price: 3.05
First target: 3.14
Second target: 3.24
Third target: 3.36

CVXUSDT | Long | DeFi Optimizer | (May 2025)CVXUSDT | Long | DeFi Optimizer Bounce with Growing Spot Demand | (May 2025)
1️⃣ Quick Insight:
CVX has caught my attention again—been watching it from the early days and now it’s starting to show strength, both on spot and futures. Current structure and sentiment are looking solid for a potential upside move.
2️⃣ Trade Parameters:
Bias: Long
Entry: Current market price
Stop Loss: $2.41
TP1: $4.75
TP2: $5.48
TP3: $5.76
TP4: $6.85
Partial Exit: Watching $4.17 closely as a short-term resistance area that could act as a milestone
3️⃣ Key Notes:
Let’s break down what CVX (Convex Finance) is. It's a DeFi protocol built on top of Curve Finance, aiming to optimize yield and boost capital efficiency. What makes it unique is that it allows users to earn boosted CRV rewards and CVX token incentives without locking up their CRV, which simplifies staking and governance participation.
CVX operates on Ethereum Layer 2, with its key partnership being with Curve. The team behind it remains anonymous, but the project is strongly community-driven.
From a market structure point of view, CVX has been showing strong spot interest and its footprint on futures markets has been growing. This confluence adds conviction to the trade idea. The structure suggests it wants to push toward $4.17 first, and if that breaks, there’s room to ride it further.
4️⃣ Follow-up:
If price confirms with good momentum past the $4.17 zone, I’ll consider updating this with a new scale-in or extended target. For now, just watching closely and ready.
Please LIKE 👍, FOLLOW ✅, SHARE 🙌 and COMMENT ✍ if you enjoy this idea! Also share your ideas and charts in the comments section below! This is best way to keep it relevant, support us, keep the content here free and allow the idea to reach as many people as possible.
Disclaimer: This is not a financial advise. Always conduct your own research. This content may include enhancements made using AI.

#CVX/USDT#CVX
The price is moving within a descending channel on the 1-hour frame and is expected to break and continue upward.
We have a trend to stabilize above the 100 moving average once again.
We have a downtrend on the RSI indicator that supports the upward move with a breakout.
We have a support area at the lower limit of the channel at 2.72, which acts as strong support from which the price can rebound.
Entry price: 2.83
First target: 2.90
Second target: 2.97
Third target: 3.06

$CVX | 1D long BINANCE:CVXUSDT is testing the top of its local range and supply zone.
A prime A+ spot setup could form on a healthy pullback. 🔥
Watching closely for a higher low to confirm continuation.
🎯 Base scenario:
— Breakout and retest of the range top inside a supply area.
— Looking for a pullback into the $1.8–$2.2 support zone.
— If a higher low forms there with confirmation, it sets up a strong long opportunity.
🛎️ Set alerts around $1.8–$2.2 and monitor for bullish signs (higher low, reclaim patterns).
🛡️ Invalidation: Clean break below $1.4 (range bottom).
Patience is key — confirmation first, entry second. 🎯

CVXUSDT | Critical Resistance Zones – Precision Trading Required🚨 High-Importance Levels Identified – Stay Ahead of the Crowd
The red box and red line represent key resistance zones where sellers are likely to be aggressive. Blindly longing into resistance is how most traders lose money, but we trade with precision and confirmations.
🔴 Short Scenario (Rejection from Red Zones):
✔️ If price rejects from these levels with clear LTF breakdowns, I will look for shorts.
✔️ Volume & CDV Confluences – We need confirmation that selling pressure is increasing before entering a position.
✔️ No Confirmation = No Trade – We don’t chase, we execute with discipline.
🟢 Long Scenario (Break & Retest Above Red Line):
✔️ If price breaks above the red line with volume and successfully retests it as support, I will look for long opportunities.
✔️ Confirmation on LTFs is crucial – Without it, there’s no reason to go long.
Why This Analysis Matters
Most traders are lost, making impulsive decisions with no strategy. That’s why my high success rate stands out. I identify the key levels before anyone else, giving you the edge needed to dominate the market.
Trading isn’t about hope—it’s about execution. If you’re serious about winning, follow the right approach.
📌I keep my charts clean and simple because I believe clarity leads to better decisions.
📌My approach is built on years of experience and a solid track record. I don’t claim to know it all but I’m confident in my ability to spot high-probability setups.
📌If you would like to learn how to use the heatmap, cumulative volume delta and volume footprint techniques that I use below to determine very accurate demand regions, you can send me a private message. I help anyone who wants it completely free of charge.
🔑I have a long list of my proven technique below:
🎯 ZENUSDT.P: Patience & Profitability | %230 Reaction from the Sniper Entry
🐶 DOGEUSDT.P: Next Move
🎨 RENDERUSDT.P: Opportunity of the Month
💎 ETHUSDT.P: Where to Retrace
🟢 BNBUSDT.P: Potential Surge
📊 BTC Dominance: Reaction Zone
🌊 WAVESUSDT.P: Demand Zone Potential
🟣 UNIUSDT.P: Long-Term Trade
🔵 XRPUSDT.P: Entry Zones
🔗 LINKUSDT.P: Follow The River
📈 BTCUSDT.P: Two Key Demand Zones
🟩 POLUSDT: Bullish Momentum
🌟 PENDLEUSDT.P: Where Opportunity Meets Precision
🔥 BTCUSDT.P: Liquidation of Highly Leveraged Longs
🌊 SOLUSDT.P: SOL's Dip - Your Opportunity
🐸 1000PEPEUSDT.P: Prime Bounce Zone Unlocked
🚀 ETHUSDT.P: Set to Explode - Don't Miss This Game Changer
🤖 IQUSDT: Smart Plan
⚡️ PONDUSDT: A Trade Not Taken Is Better Than a Losing One
💼 STMXUSDT: 2 Buying Areas
🐢 TURBOUSDT: Buy Zones and Buyer Presence
🌍 ICPUSDT.P: Massive Upside Potential | Check the Trade Update For Seeing Results
🟠 IDEXUSDT: Spot Buy Area | %26 Profit if You Trade with MSB
📌 USUALUSDT: Buyers Are Active + %70 Profit in Total
🌟 FORTHUSDT: Sniper Entry +%26 Reaction
🐳 QKCUSDT: Sniper Entry +%57 Reaction
📊 BTC.D: Retest of Key Area Highly Likely
📊 XNOUSDT %80 Reaction with a Simple Blue Box!
📊 BELUSDT Amazing %120 Reaction!
I stopped adding to the list because it's kinda tiring to add 5-10 charts in every move but you can check my profile and see that it goes on..
