DASHBTC trade ideas
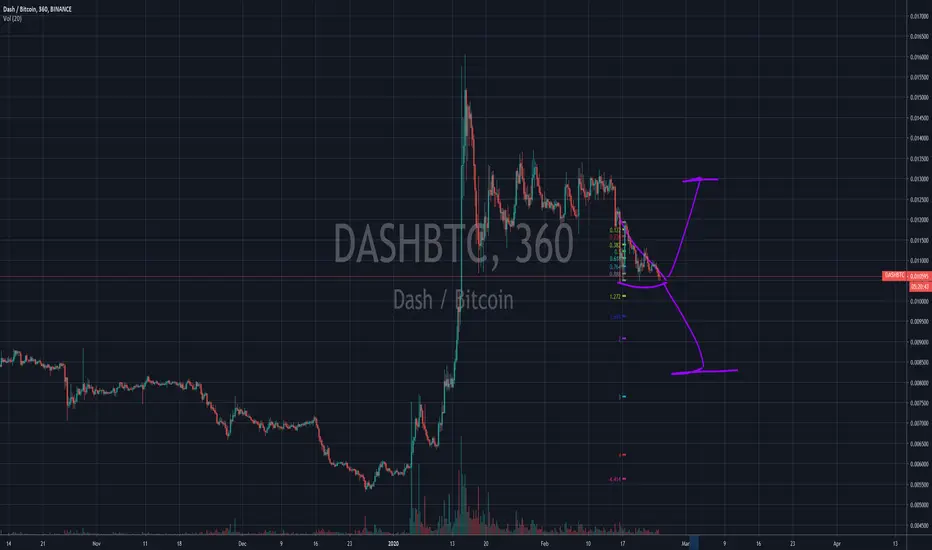
DASHBTC expecting to see higher bearish market
ENTRY: 0.010100
TP: 0.009850
TP2: 0.009600
TP3: 0.009400
SL: 0.010330
Chart time frame - 4H
Time for reaching TP - 1-2D
Follow, Like, Share or Comment
Thanks on supporting!
All best!

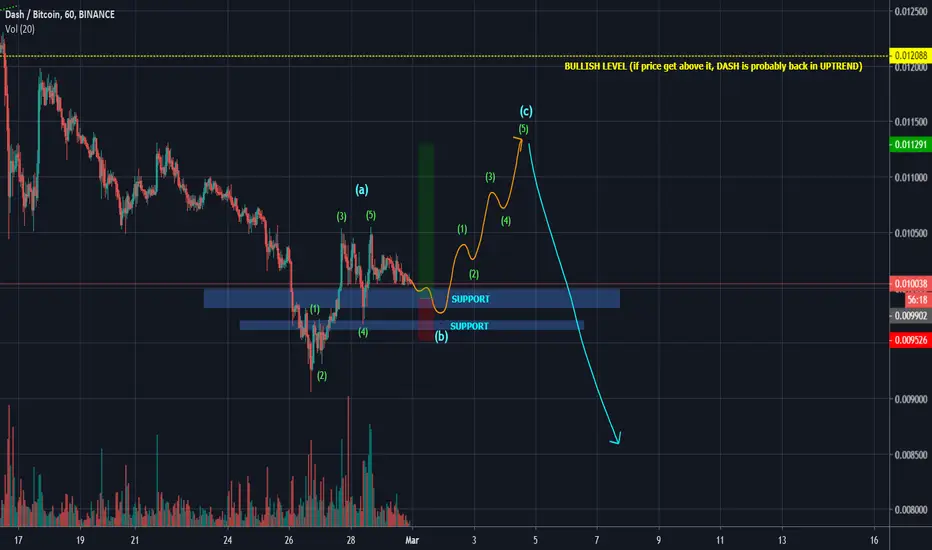
DASH/BTC - back in uptrend or only ABC correction ?DASH managed to form 5- wave impulsive structure, so we will very likely see another bullish small cycle made of 5 waves. But we don´t know, if these next 5 waves will be only part of ABC correction and DASH/BTC will continue in downtrend OR if these 5 waves will be more impulsive then previous 5 waves, DASH could be back in uptrend. Bullish level is very strong resistance, if we get above it, then I will be very bullish on DASH/BTC. I am already in long at 9902 satoshi.
DASHBTC LONG - Today's watchlist favorite Hey everyone,
After calling a setup on Dash that failed to trigger, the same setup is back a few days later.
Looking for more consolidation on lower timeframes and expect it to resume the uptrend soon.
Take care,
Vlad The Crypto Trader


DASH ANALYSIS (ONE MORE DROP EXPECTED!!)
DASH ANALYSIS:
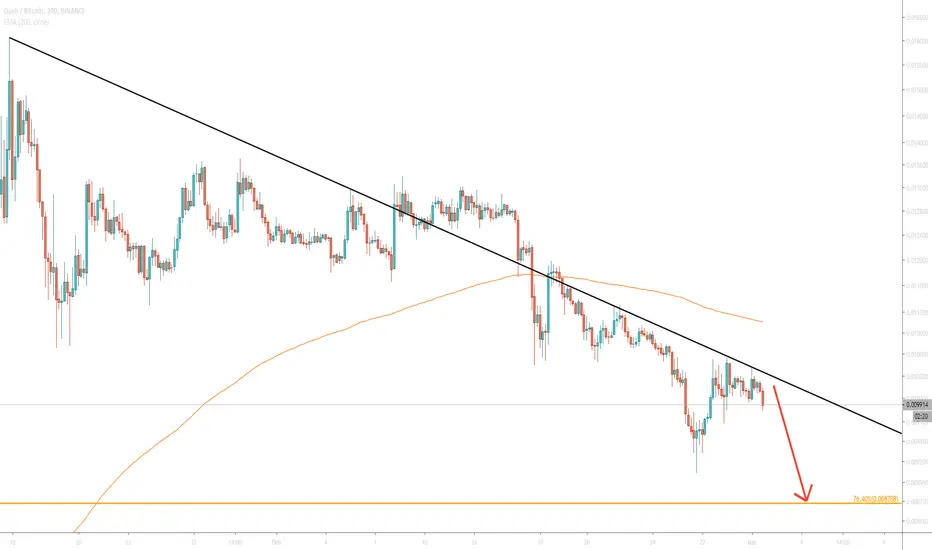
DASH is another coin on freewill after peaking into highs above .016. DASH is still on a. Hard retrace and I expect a further decline from here until the 200MA is hit. The prime entry zone for DASH Im looking at is .0087. It is possible we dip slightly below due to heavy selling. Therefore, stagger bids at and just below .0087. I expect bulls to step in upon entering this yellow box and a rapid rise to come shortly after. No sense in longing now, rather wait for another red wick on the daily chart. Stoch is heavily oversold, but RSI has another leg available to drop. Volume hasn’t bottomed either, which makes the last drop more feasible. Long term outlook rides up to T2 and T3 at .011 and .012!
Possible Entries: .0087


DASHBTC - bull flag near strong resistanceDASHBTC - bull flag near strong resistance, old trend line, breakout imminent.


DASH/BTC - North BreakoutBottom wedge, under SMA, MACD
TP 1: top wedge @ 12.5k sats
TP 2: Daily target @ 16k sats

DASH Fuelling Up For Big Launch?Looks like DASH is fuelling up for a big launch. It made some epic gains in January, but during this last run that the other big coins have made DASH hasn't really moved much. Seems like it's forming a bull flag. Looking for a close above the resistance line with some volume. Happy trading.


Dash Close to PumpHello Traders,
Dash seems to be close to finish its Elliot Wave 2 in a huge symmetrical triangle. It would be an excellent coin to invest in the near future.
We suggest to open long when it break out of those triangle.
Please push like button, you are welcome to follow us on tradingview.

DASHBTC SHORT AFTER 200% Profit Good day,
Based on the technical analysis right now have flag figure that shows us an up trend, but after 200% profit i do not think about such scenario. Additional, I sold all my Dash.
Good Luck!

DASH LongLooks good for a move up with an ascending triangle / bullflag structure. Support is close resistance is far. Long with conviction!


DASHBTCGuys, if you like the idea please put like button, this will be the best thanks. Thank you for your support, I appreciate it.

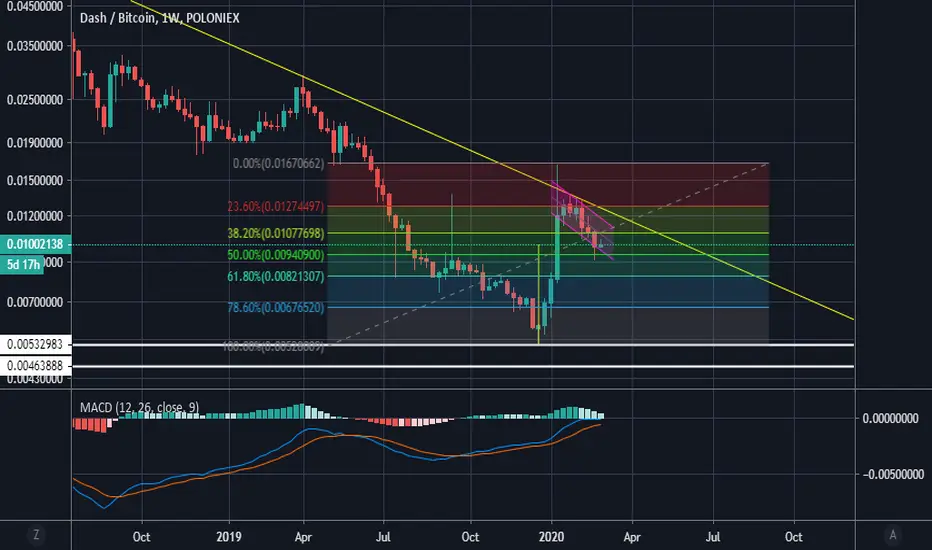
Dash flag and handle/ bullish fibonacci bounceDash went for a nice run at the beginning of january and retraced nicely with nice bounces off the .50 fib and accumulating between .382 /.236 indication of bullish signs in the future. Another strong confirmation of bullish signs is the flag and handle chart pattern. In the past this indicator has been signs for bullish movement. Buy zone is 11k satoshis to 13k satoshis . With the Take profit point being 20k to 22k. Stop loss point is 10k satoshis.

DASHBTC ACCUMILATING FOR WAVE 5Im not an expert on abcde formations but i know this happens lots of times and its common for wave 4.
It accumulates for a while and then it pushes for 1 more wave.


DASH/BTC BINANCE4H Candles analysis
If price breaks the uptrend parallel channel
or Ichimoku cloud
BUY IN AREA
0.009257 to 0.0113 satoshi
Low volume
crossing MACD bearish
If the price breaks the downtrend info line then,
New Chart Analysis is needed
Good Luck
