DASH-ing to new all time high?DASH looks set to break out of a long term downtrend. Organic, slow growth is what I like. Will fire long out of this squeeze with a few more days of buy activity. With good volume she'll run...or "dash" (get it?).
Potential adam & eve, but the second formation is a bit too high.
DASHBTC trade ideas

Dash (DASHBTC) Finds Support: Will Move Bull Again (100% PP)Dash (DASHBTC)’ completed its retrace after it had a nice run. Right now support is being established and soon DashBTC will move again.
Let's take a quick look at some of the signals:
Retraced fully, after several weeks of bullish action yet DASH made a higher low.
RSI bounced from oversold and the MACD is curving up, more signals that support is being found and retrace completed.
Decreasing volume.
Inverted hammer candlestick.
DASHBTC will move soon.
Here is our long term trade for DASH:
Thanks a lot for reading.
If you appreciate this notification, for profits, please hit like now, share, comment and follow.
Namaste.


A trading opportunity to buy in DSHBTCTechnical analysis:
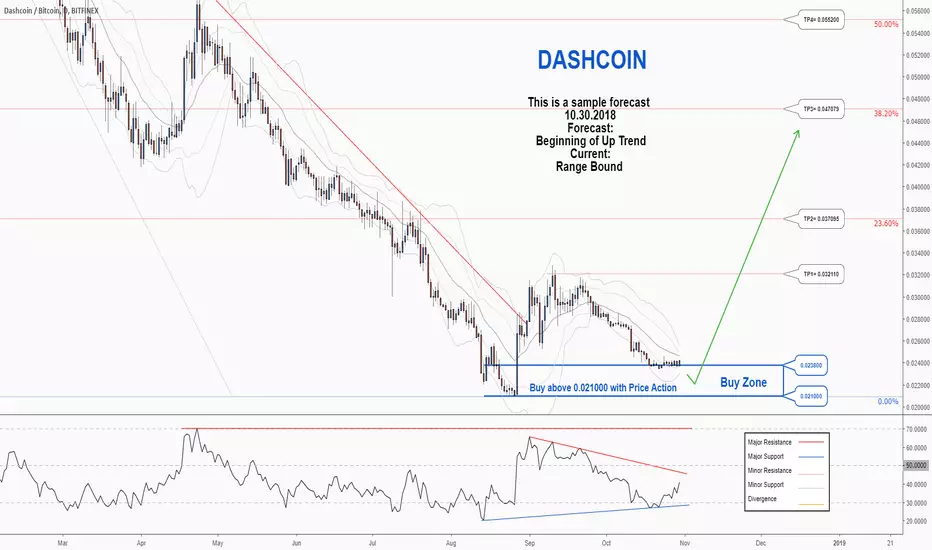
. DASHCOIN/BITCOIN is in a range bound and the beginning of uptrend is expected.
. The price is below the 21-Day WEMA which acts as a dynamic resistance.
. The RSI is at 40.
. The price downtrend in the daily chart is broken, so the probability of the resumption of an uptrend is increased.
Trading suggestion:
. There is a possibility of temporary retracement to suggested support zone (0.023800 to 0.021000). if so, traders can set orders based on Price Action and expect to reach short-term targets.
Beginning of entry zone (0.023800)
Ending of entry zone (0.021000)
Entry signal:
Signal to enter the market occurs when the price comes to "Buy zone" then forms one of the reversal patterns, whether "Bullish Engulfing" , "Hammer" or "Valley" in other words,
NO entry signal when the price comes to the zone BUT after any of the reversal patterns is formed in the zone.
To learn more about "Entry signal" and the special version of our "Price Action" strategy FOLLOW our lessons:
Take Profits:
TP1= @ 0.032110
TP2= @ 0.037095
TP3= @ 0.047079
TP4= @ 0.055200
TP5= @ 0.063260
TP6= @ 0.074765
TP7= @ 0.089450
TP8= Free
A trading opportunity to buy in DSHBTCTechnical analysis:
. DASHCOIN/BITCOIN is in a range bound and the beginning of uptrend is expected.
. The price is below the 21-Day WEMA which acts as a dynamic resistance.
. The RSI is at 40.
. The price downtrend in the daily chart is broken, so the probability of the resumption of an uptrend is increased.
Trading suggestion:
. There is a possibility of temporary retracement to suggested support zone (0.023800 to 0.021000). if so, traders can set orders based on Price Action and expect to reach short-term targets.
Beginning of entry zone (0.023800)
Ending of entry zone (0.021000)
Entry signal:
Signal to enter the market occurs when the price comes to "Buy zone" then forms one of the reversal patterns, whether "Bullish Engulfing" , "Hammer" or "Valley" in other words,
NO entry signal when the price comes to the zone BUT after any of the reversal patterns is formed in the zone.
To learn more about "Entry signal" and the special version of our "Price Action" strategy FOLLOW our lessons:
Take Profits:
TP1= @ 0.032110
TP2= @ 0.037095
TP3= @ 0.047079
TP4= @ 0.055200
TP5= @ 0.063260
TP6= @ 0.074765
TP7= @ 0.089450
TP8= Free


dash looks like its ready to start popingthe trend turned around and it has a nice wedge that just broke out. two really good signs. I expect this to continue up....


DASH Poised for a Beautiful Breakout to the UpsideDASH/BTC is poised for a beautiful breakout to the upside, similar to that of XRPBTC a few days ago. Breaking out of this wedge resistance wall is imperative to continued confidence. RSI and MACD on the Daily showing that the gains are just starting for DASH and that this is VERY likely to break through wedge resistance. Sells marked at red levels per fibonacci retracement tool.


DASHBTCDASH/BTC
Perhaps the formation of a double bottom on the daily chart
Buy zone looks attractive


Dash BreakoutDash is under 30 on its 1 day RSI it has crossed lines on MACD. The volume is decent at 402btc on Binance. Currenlty other than PUNDI X this is lowest daily RSI. Buy at the bottom ride to the top on 30 min candles on RSI 70, 30.

Dash is worth a watch - Loooow RSI, Stoch and MacdI think Dash is worth watching closely, the RSI is in oversold territory, stochastics are low and the macd looks like it may be finding a bottom soon. As you can see the RSI getting into the oversold area is no guarantee it will move up, its lingered down there for months in the past but its still worth setting some alerts to keep an eye on.
Last burst in price from this area seen a 50ish% move up. I haven't opened any positions yet but watching closely.
Short term
Be careful buying it because BTC is moving up. It doesn't always follow BTC's lead right away so if you're looking for quick gains, you could be playing with fire.
Long term
I think its a good buy, solid fundamentals but do your own DD.

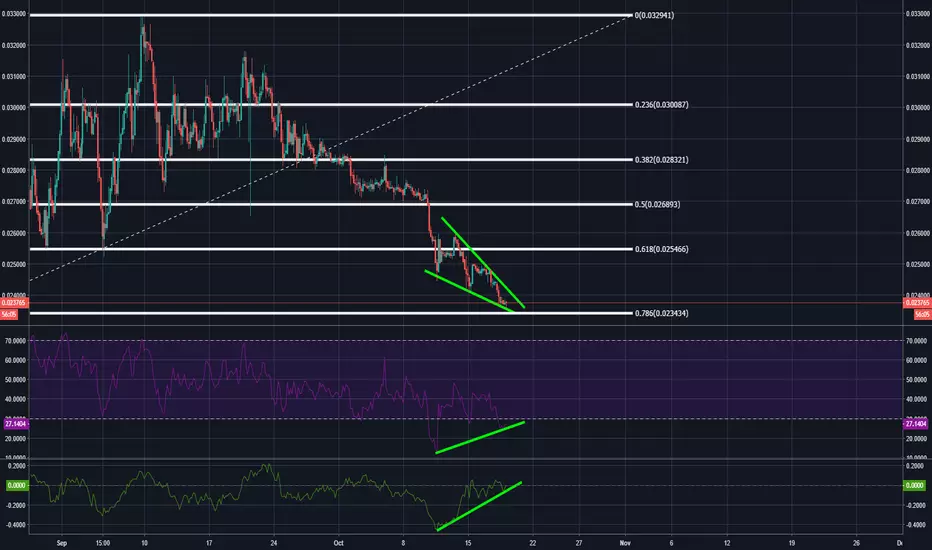
DASH showing Bullish Divergence, and within a falling wedge.DASH/BTC is showing bullish divergence on the RSI and on the CMF on the 4-hour indicator. MACD is also showing bullish divergence, but I did not show it here. Alongside that, it is within a falling wedge pattern as it nears support on the .786 fib line. If you guys caught my LTC/BTC analysis from last night, this looks eerily similar. Only risk is if BTC decides to move down. I made another analysis where I outlined why I thought it would go down, but the bulls defended 6360-6370 with some force, so there is a chance we could see it move to the upside, it's honestly 50/50 right now for which direction BTC will take.
Higher risk entry: 23600-23800.
Best Entry: 23435-23550 (I'm guessing it will go down to these levels before moving up, but there is a chance it could break to the upside before then, so do your own diligence and risk-assessment.)
Target 1: 25450
Target 2: 27200
Target 3: 30000
SL: 22000-23000 depending on risk level.
Big thanks to cervantescerville for telling me to check out DASH, wouldn't have checked it out had he not sent me images of the fib lines and of the bullish divergence on the RSI and MACD.
--This is not financial advice. Always do your own research and come to your own conclusions before buying/investing, as investing in cryptocurrencies comes with high risk and high amounts of volatility.


#DASH #BITCOIN #BITCOINPRICE #TRADING #BITDHARMAProfit Target:
- 25900 Sats
- 28000 Sats
- 33000 Sats
Stop Loss:
- 21042 Sats


Dash hitting 18 Month Low, ignoring the Mass Adoption.Since September 2018, Dash has reached mass adoption, accepting over 3,600 merchants worldwide. This is an astonishing achievement by the Dash team as the main criteria for cryptocurrency growth is the actual use case. With Dash, it is clear that over the long term price is more likely to increase, rather than continue trending downwards. Just consider the fact of the massive growing adoption potential if Dash will continue to add merchants at this rate.
The paradox is that while Dash is getting massive exposure and increasing number of partners, price remains at low levels. It’s like all good news are being ignored by the market and seems like Bitcoin is still dictating the pace to all altcoins. Perhaps when BTC will start producing higher highs and higher lows, Dash will outperform Bitcoin and many other Alts, just based on the current usecase.
On the 22nd of August Dash has reached 18 month low, hitting btc 0.02. This is a substantial decline from the all-time high, which has resulted in a 83% loss to Bitcoin. After hitting the low, Dash has moved up and broke above the descending channel, followed by the breakout of the btc 0.03 resistance. However at the btc 0.033 high, RSI oscillator registered a bearish divergence and DASH/BTC entered a consolidation phase.
Currently Dash is trading between btc 0.025 support and 0.030 resistance and obviously lucking high trade volume that would enable price to move in any direction. Nevertheless, the btc 0.022-0.025 support area could be price range where trading activity will pick up, and bulls might start buying Dash. However, as the major trend is down, break below the support is possible, making Dash a risky purchase at this time.
Watching the trade volume along with the resistance breakout should help investors to determine short and medium term trend. If price breaks below the btc 0.022 support, Dash could fall down to btc 0.01 support area. But, on the other hand, daily break and close above the btc 0.033 resistance could trigger buy limit orders, pushing price up to btc 0.044 or 0.060 resistance level.
Support:
1. 0.025
2. 0.022
3. 0.012
Resistance:
1. 0.033
2. 0.044
3. 0.060

Dash/Bitcoin Long Play
Daily at a glance - The daily chart looks like it is finding support on a horizontal TL and the bottom of the Ichimoku cloud. Rsi is neutral, all other oscillators bullish.
This is the target for a bullish move from here, based off of horizontal and Ichimoku edge to edge.
Possible reversal zones are red horizontals, these come from volume profile points of control, and have provided resistance and support in the past. The two red highlighted boxes are the zones I would plan to hedge short.
