[DASH][MFT][XST][AUR] The Alts [ALTCOINS] Are Starting To Move!I can see many alts moving into the positive and suddenly, last time this happened Bitcoin grew in price from $5850 to $8400+. Is this the second round?
Another wave up is coming!
TIME TO BUY BITCOIN and ALTCOINS! (First recommended back in Mid August)
Altcoins going up can be a bullish signal for Bitcoin, but why?
Smart money/traders/buyers/investors/whales will never buy when the market is about to go down, or else they wouldn't be considered "smart". Instead, they buy at the bottom, right before the market turns green and starts to go up. So, each time I see the altcoins going up strong for no reason, with Bitcoin sitting around strong support, I take it as a signal that Bitcoin might be moving up in a new up wave.
I just wanted to mention this, since I am seeing some coins wake up that have been sleeping (going down) for a while now.
Please share your thoughts with us about this, or about the market conditions in general for Bitcoin and the Altcoins, in the comments section below.
Thanks again for reading...
Alan Masters here...
Namaste.
DASHBTC trade ideas


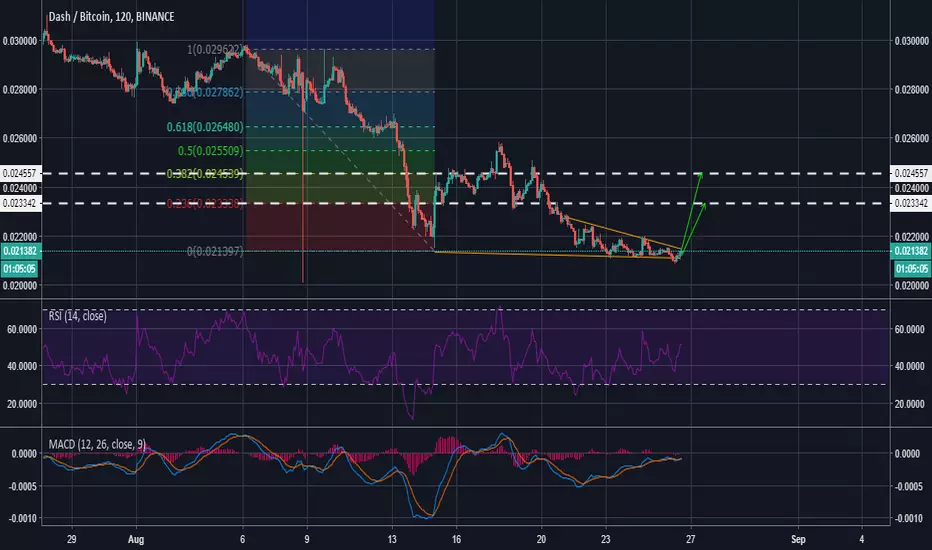
Bullish alert : DASHBTCDash already break channel down and forming bullish flag pattern.
We have 2 target for this setup :
1. At resistance line at 0.032359
2. At bullish flag projection at 0.036964
Note : if this pattern failed price will back to support at 0.022008
Good luck

Simple price projection: Dash is going places again. Oct 15We are still not out of the woods yet, but this bounce on support line is strong!
We have not broken out from the descending wedge and moving averaging is still indicating a bear.
However, it is possible we maybe having a repeat from 2015 Dec rally.
I have included a shadow rally from that time.
Stop loss included.
Hopefully Dash does well and can put all that FUD behind.!
Fractal dates Oct 15 and Oct 2 -2019
**LEGENDS**
BLUE = Bear/Resistance
Yellow = Bull/ Support
~Explore the chart for possible scenarios of price actions - use zoom and scroll for better view.~
/*This information is not a recommendation to buy or sell. It is to be used for educational purposes only.*/
If you want your coin to be analysed, JUST ask.
If you got a question, ASK away!
And please keep those Stop losses in place!
Fractal dates are moments of interest, where price and time collide to create oscillation.
Thank you,
Ajion


Dash - decision time A decision time for the #Dash. After creating a series of bearish candles and lower highs in the four-month period, the coin has rebounded in the last couple of days and it is currently reaching the key zone between 0.02500 and 0.02700. It is a zone consisting of the key Fibonacci support zones - 38.2% to 61.8% - coupled with a series of horizontal support lines creating a resistance block. Moreover, the 100 MA on the hourly chart is also providing an obstacle for bulls to advance further. A push through this zone may facilitate a move above 0.02700, which would prove to be a major step for the bulls. In this case, a move to test the major trend line resistance, currently sitting just below 0.03000, would be on the cards. However, the more likely scenario is the rotation back lower to test recent swing lows around 0.02200. The major support for the bulls sits around 0.01800, which represents a major trend line support.


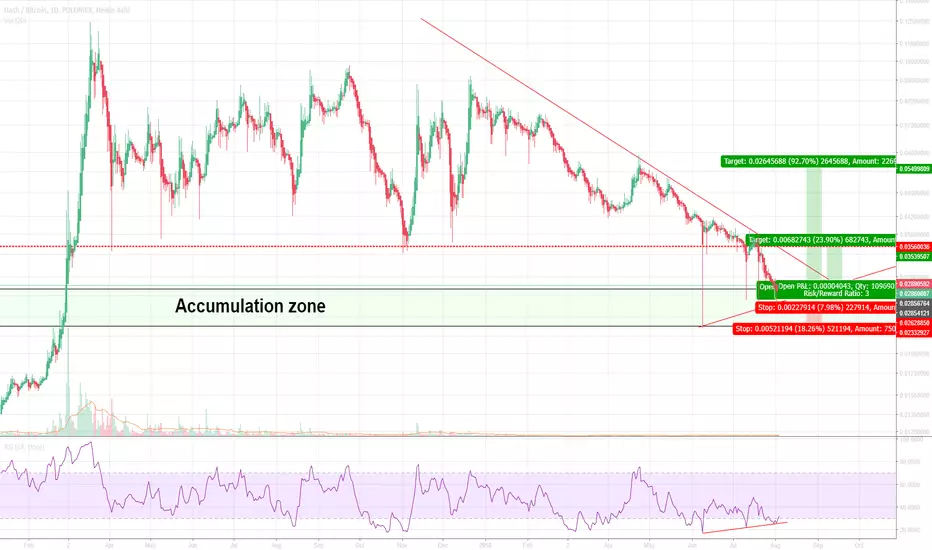
DASH may be close to a major reversalfor the past month of so we've finally been testing my accumulation zone, and with rising lows on the wicks, along with the overall market shift, and lastly because DASH is an actually used and fairly old and fast coin, I can see amajor reversal in the works any day now.
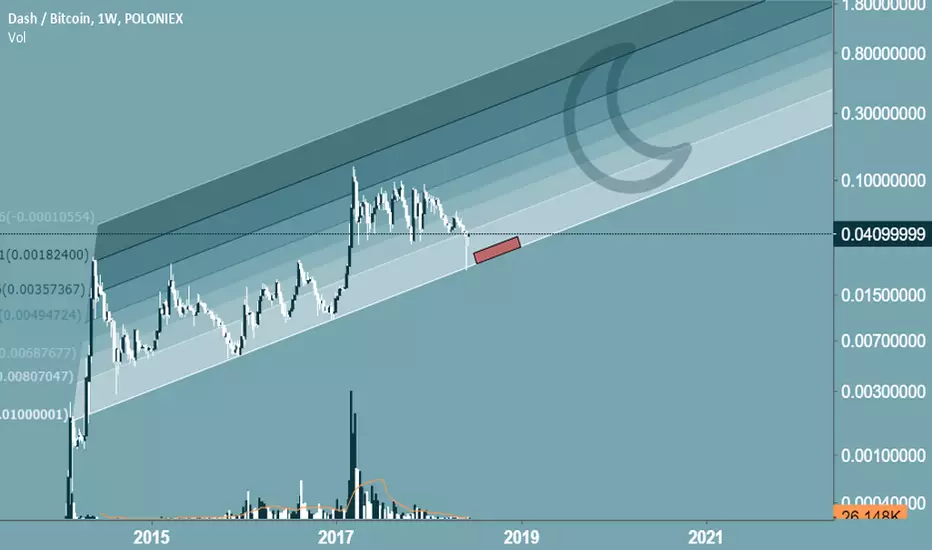
A look at the weekly with Heikin Ashi DOES however reveal some scary downward momentum, though also gives us a better long term look at potential profits
All in all, I could actually see the argument for a short here, so I won't recommend anything, though, as a disclosure I did open a very small leveraged long position on DASH. However, should we firmly break either of the red trend lines, I would take that as a major sign of our future movement.
DASHBTC - High Volume ALT coin strategy on Poloniex exchangeSimple 15min time-frame strategy using 4 technical indicators.
DASHBTC: (20.54% return over ~1.5 months = ~13.69% a month return on investment, 1.04% max drawdown, total of 49 trades = 1+ trade per day)
Uses:
1. Nested bollingers (multiple lengths)
2. MACD
3. Fibo retracement
4. RSI
IF:
#1 (i.e. all bollingers are crossed) and;
#2 (i.e. macd crosses) and;
#3 (i.e. high/low fib lines are crossed) and;
#4 (i.e. RSI bands are crossed)
THEN: BUY/SELL
Comment: The following is applied to the back testing:
0.25% commission
5000 ticks slippage
Recalculate after every tick
Recalculate after order filled.

TF T&I XVIII Chart X Overbought/Oversold IndicatorIn this chart we can observe the use of an RSI on the Dash/Bitcoin Pair. The RSI allows us to determine if a Coin is Overbought o if it is Oversold. Depending upon the line. If it crosses 70 or higher then it is called Overbought, but if the line crosses 30 or below then is considered to be Oversold.

DSHBTC investment opportunityWonder what to do with the coin on the lowest level of the price ever? All supports had broke and TA does not allow to determine the further movement? This is an awesome investment opportunity. Personally, I'd bought DSH and will have bought it more in case of price down. My position is to purchase of such assets not more than 1-2% of depo for mid and long term. Good luck!

Dash - Overbought Long/MidDash supply is very limited by freezing tokens in masternodes. Over 60% of entire tokens in circulation is frozen. I think if we hit first line, many master nodes may get liquidated because of sign that bubble is bursting. Dash tokens will come on the market and we may see really incredible bubble burst.

DASH SHORT SCENARIOThis is little bit less optimistic scenario considering my other charts, however retesting lows getting more serious each day we are not breaking up.


Buy low, sell high Here's another example of where one could have had a buy order on a high MC/low CS coin at a ridiculously low price while holding ETH or BTC. The low CS coins seem to have semi-frequent flash crashes.

DASH/BTCIt's a long, but again, WAIT for the insiders to reverse the market.
The last thing you want is to have a long open while they finish shaking out the market.
You see the dump wicks... They want ALL the plebs' money. Don't let them get yours.

Be careful with DashIt's going to loose 70% more of it's value. Unless huge news and fomo will draw a huge breakout.
