dashDash is above the 200 DEMA vs ETH for the 1st time since 3/2020.
Dash has previously broke above and then Nuked quickly below.
But still something I think is worth paying attention to.
Related pairs

DASHETH - Long - Potential 24.5%DASHETH - Long - Potential 24.5%
Exchanges: Bittrex, Binance, KuCoin
Signal Type: Regular (Long)
Entry Zone:
0.04150 - 0.04377
Take-Profit Targets:
1) 0.04588
2) 0.04984
3) 0.05419
Stop Targets:
1) 0.03777
Entry Trigger - Heavily Oversold, on bottom support, trend break

Eyes on Dash | 1200% potential | Long | DashEthEyes on Dash Eth - the sleeping giant no-one talks about.
----------------
Weekly
-
Market Cap Eth 1,185,373
24 Hour Trading Vol Eth 571,779
-
Green = Resistance
Red = Support
-
All-Time High in #Eth was Eth 5.611519
-
PA was sent down from 20 ema.
The right time to accumulate.
Landing on Moon in O

Dash / EthereumFollowing a 90% correction and oversold condition (orange column) an ‘incredible buy’ opportunity now exists. The Bollinger Band overlay is included on the above 1-day chart to illustrate how overextended price action is, 50% away from the mean (centre black line). This is ridiculous.
Whether you’r


DASH / ETH looks ready for takeoffDash is incredibly undervalued against ETH right now. TP levels shown.

DASH/ETH Massive rally aheadIf bulls succeed in breaking the and sustain above 0.22-23 level (the moving average) then the probability of the trend reversal is rising, and we can expect the big moves from DASH.

Regular Bullish Divergence on weekly. Invest 1%, SL @5% loss.Regular divergence is the classic sense of divergence that occurs when the price action makes higher highs or lower lows while the oscillating indicator does not. This indicates a weakness in the price action and anearly warning that the trend could be coming to an end. In other words, regular diver

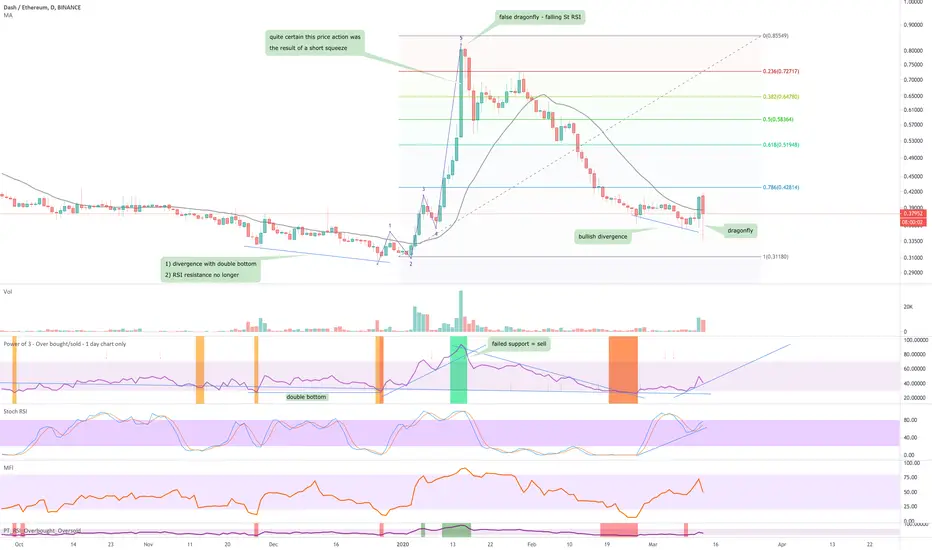
Dash vs Ethereum1-day chart showing us bullish divergence on the Dash / Ethereum pair together with Higher Lows on the Stochastic RSI following a (as if you hadn't noticed!) a strong oversold period. In addition price action has just made a band-to-band transition to the bullish half of the Bollinger band to find s

See all ideas
Summarizing what the indicators are suggesting.
Oscillators
Neutral
SellBuy
Strong sellStrong buy
Strong sellSellNeutralBuyStrong buy
Oscillators
Neutral
SellBuy
Strong sellStrong buy
Strong sellSellNeutralBuyStrong buy
Summary
Neutral
SellBuy
Strong sellStrong buy
Strong sellSellNeutralBuyStrong buy
Summary
Neutral
SellBuy
Strong sellStrong buy
Strong sellSellNeutralBuyStrong buy
Summary
Neutral
SellBuy
Strong sellStrong buy
Strong sellSellNeutralBuyStrong buy
Moving Averages
Neutral
SellBuy
Strong sellStrong buy
Strong sellSellNeutralBuyStrong buy
Moving Averages
Neutral
SellBuy
Strong sellStrong buy
Strong sellSellNeutralBuyStrong buy
Displays a symbol's price movements over previous years to identify recurring trends.