DASH BULLISH DASHDASH is lookking pretty good. going to start its breakout to 500 very very soon from this triangle on declining volume
DASHUSD trade ideas

DASHThe live Dash price today is $236,57 USD with a 24-hour trading volume of $691.140.806 USD. We update our DASH to USD price in real-time. Dash is down ,64% in the last 24 hours. The current CoinMarketCap ranking is #71, with a live market cap of $2.465.855.910 USD. It has a circulating supply of 10.423.383 DASH coins and a max. supply of 18.900.000 DASH coins.

DASH/USD Upside!DASH/USD is starting to take off, as the crypto bull market is heating up. DASH is set to follow suite of Litecoin yesterday, breaking back above the 200 USD mark, and running to the upside. We’re targeting a double in price (nearly) with relatively low risk.
Upside target: 400
Violated below: 175

Dash beginning run to $1000Dash and Litecoin have been swept under the rug as meme coins and NFTs became the new hype… many don’t expect much from these coins because how poorly they’ve performed during this bull run. However as we come near the end of making new highs for the market for a while, I believe this coin is preparing for an amazing finisher just like the previous bull run! As you can see I have a blue chart pattern of previous price history to predict future movements. So far I’ve tried this on multiple coins and it deems quite accurate. Dash had a euphoric rise last bull run but now unfortunately the blue chart displays a lower peak to match the current price. So with that being said, the top for Dash this run will be around $1000 but you must get in now as it’s ready to blast!

Dash TP hit Dashusd flew thru TP1. Will see TP2 in the near future :) i linked my original idea below


DASH buyGetting on the confirmed break of the downtrend
Buy:230$
TP1: 272$
TP2:323$
TP3:396$
TP4:489$

Dash Elliott wave projectionAnalysis based on Elliott wave projection
Black line is for exiting your position gradually

DASH/USDTesting/tracking elliot wave theory. Please do not trade off idea without S/L. Not financial advice.
I will be attempting to track sub waves to see if i can predict movements more accurately. It probably won't end well lol but we'll see how it goes

DASH - Waiting For Breakout!Hi, this is my new update for DASH. After three days with red candles we are smashing all of them with one big green candle. Right now we are in a critical moment, first of all we have smashed both 100D moving average and 200D moving average at the same time and if today we close the candle above these levels then we are good to go, but we have one big trendline that we have already been rejected 6 times, so it is very important to get through it and close one candle above it. If we break the trendline the next stop is to test the resistance $215 and if we break that too then we are ready to fill the gap between $215-250. I expect professional traders are going to take positions when we close the candle above the trendline and we are going easily to break the $215 resistance. So be patient and don't PANIC ;)

DASHUSD ViewA trendline that can be drawn on the DASHUSD 1D chart
A clear pivot point
Very close to this point
Closer the better the buy potential

DASH - Ascending TriangleUPT:
1. 290
2. 334 to 346 (Golden Pocket)
DPT
1. 146
Price action is KING!
More power to all your trades, my friends!
Ron
Intrepid_Trader

DASHUSD ForecastDASH is rising but there is significant resistance at 198.041
Our potential target is 203.133 and the bias is 205.956
*It is a lovely coin, I heard that it was built upon a beautiful concept. I just don't remember what that concept was though.
.
Khiwe
On this profile page, the shared analysis, ideas, and also, the strategy of a chart belong to Khiwe with some being influenced. The technical set-ups are speculative, they are not guaranteed for accuracy or completeness in the form of any content; it is not to advise on financial markets. Please apply your own analysis and confirm it with price action.

DASHUSD 05/11Weekly:
h&s
weekly bearish candle with a wick that we can expect to get filled
Daily:
h&s
4H:
h&s + bearish W

DASH - Potential Long Opportunity If the prospect of another crypto bull cycle is upon us, this could be an opportunity to accumulate more KRAKEN:DASHUSD . The macro picture is a long standing Wycoff Accumulation pattern which appears to be nearing completion.

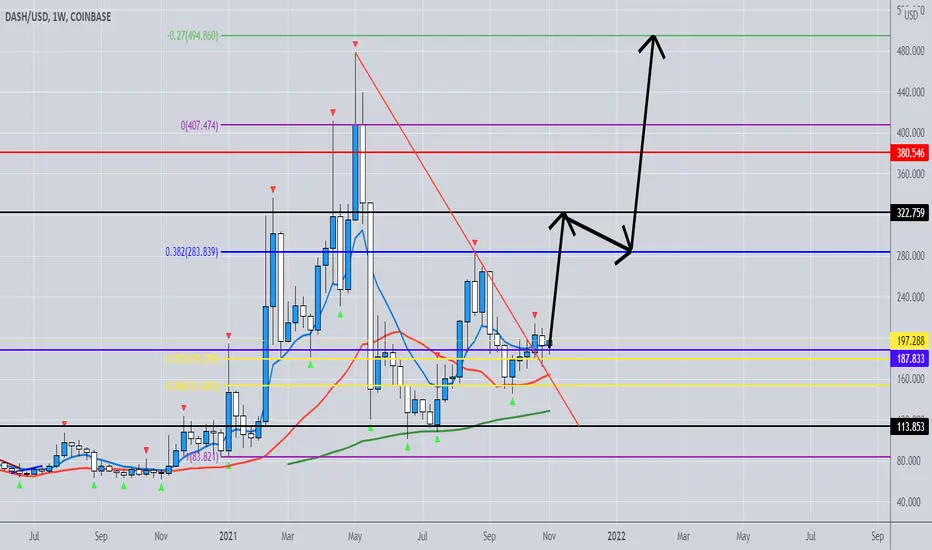
Dash to $500?11/02/21 - Dash has broken out of heavy downward momentum.
Looking to rally towards $283-325 dollars before I project a pullback before continuing towards $494 first TP level before $500 a coin.
Waking Up Like a GiantI'm stuck in another coin which has an aggressive sellling pressure right now but hope Dash wont pump without me, wait for me DASH :((
First target $1000. then to the moon. Do your own reasearch about DASH.

DASHUSDWeekly:
h&s
Daily:
We had big bearish impulse, retest level has been hit
4H:
The big driver is still bearish.
We now have a pattern in a pattern with the bearish W and the h&s

Buying DASHUSDdashusd has strong bullish signs on the smaller timeframes as well as the daily! Getting in here entry on the m15. Still has room to come down a little, maybe! so trade with caution :))

BULLISH - DASHDASH: looks like a tank imo. Still consolidating in this symmetrical triangle before it rips to 490-500

Breakout ascending channelAs you can see price has been breakout ascending channel on daily timeframe. I have sold my dash coin asset and wait on $100 or $70. Like if you agree


144. & 132 ifA retest of 220. on light demand would provide a good sell entry. Or a break directly under 185 on SOW.
Having to be careful and sure supply is in overweight because 185. did show some resilience in the past, which price could just also move straight upward from there.
Break upside 220. would make me aim at 245 as scalping buy area, and then look again for a sell entry around it.
Now testing support... ain't little time frame being stagnant.
As for the;
Monthly
On the first 4 months of the year, there was a lot of effort from demand that was put on making the price go higher.
Which from where price then get pushed to the upside to 280, on barely effort from demand. Which make sense from selling interest that took a break, which is probably the main reason why price got even pushed higher. From which we can see because once it reach the 292 area it start showing having barely buying presence, and more of selling that took a break this time, from price wicking the zone with a easy stop in action.
At the same area that showed important demand weakening back at the beginning of the year.
On the weekly..
Daily
Stating for now that buying interest ain't much of a presence.
No matter the direction it goes, there's many opportunities as for both side. The question is will it retrace upward before moving downside, or will it move straight downside. And as I read the volume for NOW, if it do retrace upward, unless there's a wave of buying interest emerging, it shall not retrace that much up or it will just move straight down.
