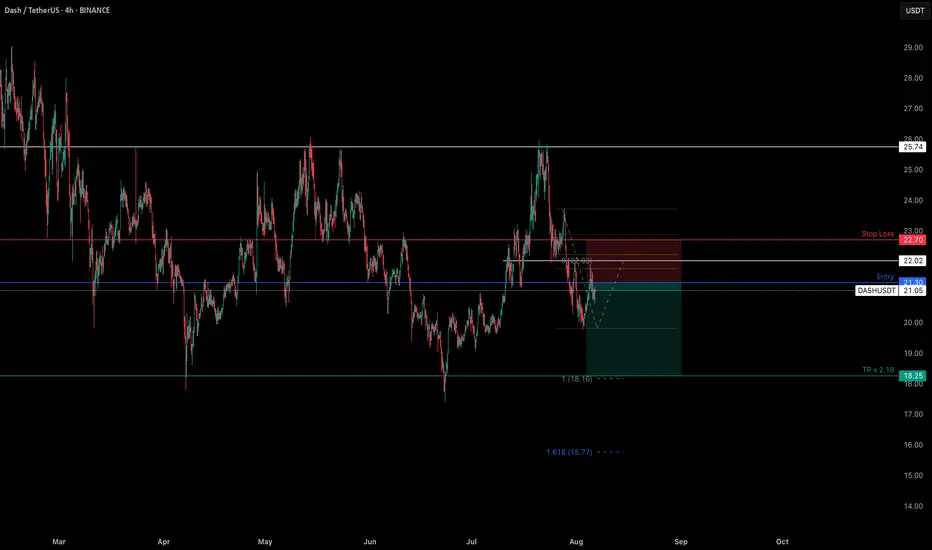
DASHUSDT - SHORTMarket Structure: Based on the 1D TF, there is a support level @ 17.25 and a resistance level @ 25.74. On July 23, the price of DASHUSDT bounced off the resistance level therefore we can assume that the price will move towards the support level @ 17.25.
Area of Value: Based on the 4H TF, we can see the possible pivot points with the confluence of the Fib. Retracement and Resistance level @ 22.02.
Entry: We have entered the trade @ 21.30, after a justifiable bounce off our Area of Value.
Exits:
- Stop Loss level @ 22.70 which is the top off our bounce + ATR Value.
- Take Profit @ 18.25 which respects the Fib. Extension @ 18.16, and Support level @ 17.25
Max R:R = 2.18
DASHUSDT trade ideas
DASH double top (Chart is inverted)Using this source as it highlights the basing pattern better.
Crypto is annoying due to the multiple sources and exchange dependancy, as my crypto.com sourced chart doesn't highlight the highest the basing line could be.
Not financial advice

DASHUSDT 2D AnalysisDASH ~ 2D Analysis
#DASH Buy back gradually from this support block with short term target of at least 15%+ , Long term target $65

DASHBreak the floors one by one
In the short term, if the blue one is not lost, it will go to the red box, and if it fails, the first step is the orange lines
But if it fails, it should come to the green ones
If you read it, you can make sharp moves, they can grow between 60 and 240 percent. But entry is important

DASH/USDT , 1DPattern is Broken Out and Retesting the Trendline
if Bitcoin is continues its bullishness , then we can take up this trade
Enter with proper risk management , allocate less first and them allocate more if the direction is confirm

Bearish Momentum Resumes in DASH – Entry, Target, and Risk LevelThe daily chart shows a clear downtrend within a defined bearish channel where the price has been forming lower highs and lower lows. After a false breakout above the channel resistance in late April, the price failed to hold above that breakout level and quickly dropped back into the channel — a classic bearish signal that confirms the ongoing downward pressure.
Read My Latest Analysis on LTC , XRP and BNB
At present, DASH is trading around $21.02 to $21.19, just below the upper trendline of the descending channel. This area has acted as a resistance zone, especially after the false breakout failed to gain momentum. The broader structure indicates that the bears are still in control.
Your short entry should ideally be placed between $21.00 and $21.20, just under the resistance line. The target for this trade would be the key support area at $17.86, and if the bearish momentum strengthens, the next level to watch is $15.00, which is a strong historical support and psychological round number.
A reasonable stop-loss for this trade would be $25.12, which is above the most recent high where the false breakout occurred. If price climbs back to that level, it would invalidate the bearish setup.
This trade setup offers a good risk-reward ratio — aiming for a potential drop of 15–28% while risking around 19%. The rejection after the breakout and return into the bearish channel suggests that sellers have regained control and that the price is likely to retest the support levels in the coming days or weeks.

Technical Analysis for $Dash:🔵
#DASH Price is currently moving above a strong collection area, suggesting a potential bullish move.
Key Support Level: The strong support lies between 20.00 – 21.00 USD.
Safe entry if the price maintains above 21.00$.
Or after a corrective move towards 21.00$ with a confirmed bounce.
📈 Target Levels (TPs):
🎯 Target 1: 44.00 USD
🎯 Target 2: 60.00 USD
⚠️ Note: Breaking above the 27$–30$ area with strong volume will confirm the bullish trend continuation toward the targets.

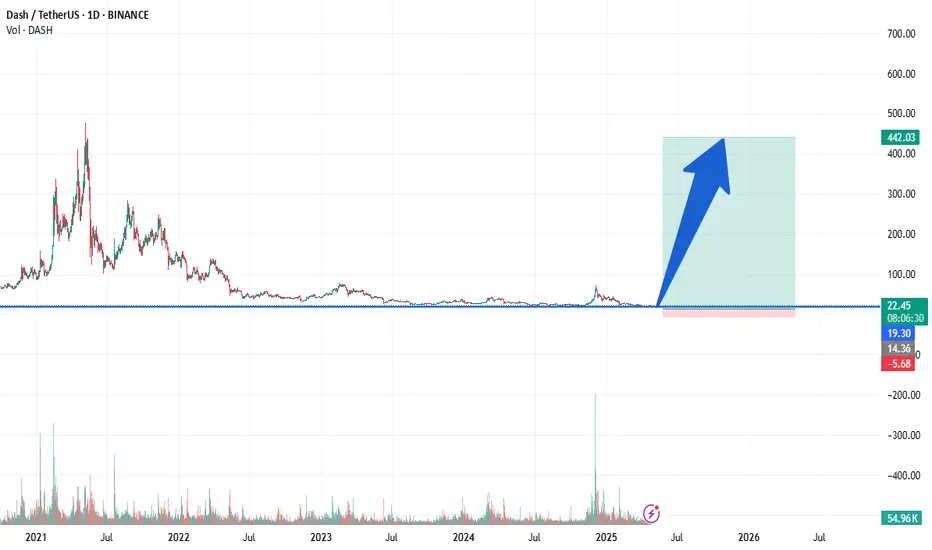
DASHCOIN BULLISHDASH COIN IS PRETTY BULLISH AND GOOD TO HOLD FOR A LONGTERM YOU CAN GET UP TO 3000% gain to max your Earnings. NOW IS THE TIME TO BUY BOTTOM IS HERE at this current price level!
As of April 25, 2025, Dash (DASH) is experiencing a bullish trend, with its price ranging between $29.05 and $32.41 for the month. This marks a significant recovery from earlier in the year, indicating renewed investor confidence and market interest.
📈 Dash Price Forecast for 2025
Analysts have provided the following projections for Dash's price movement throughout 2025:
May 2025: Expected to trade between $30.25 and $33.91, with an average price of $31.35.
CoinCodex
+3
InvestMage 🧙
+3
CryptoDisrupt
+3
June 2025: Anticipated range of $31.78 to $35.48, averaging $32.60.
CryptoDisrupt
July 2025: Forecasted between $32.76 and $36.78, with an average of $33.58.
CryptoDisrupt
These projections suggest a steady upward trajectory, potentially reaching a high of $44.59 by December 2025.
CryptoDisrupt
🔍 Factors Influencing Dash's Bullish Outlook
Several elements contribute to Dash's positive market performance:
Enhanced Privacy Features: Dash's emphasis on privacy and fast transactions appeals to users seeking secure alternatives to traditional financial systems.
Investopedia
Masternode Network: The masternode structure not only facilitates faster transactions but also supports governance and funding for network improvements.
Investopedia
Market Sentiment: A neutral Fear & Greed Index of 54 indicates balanced investor sentiment, with a slight tilt towards bullishness.
CoinCodex
⚠️ Considerations
While Dash's outlook appears promising, potential investors should be aware of:
Regulatory Challenges: Privacy-focused cryptocurrencies like Dash face scrutiny in various jurisdictions, which could impact adoption and usage.
Investopedia
Market Volatility: Cryptocurrency markets are inherently volatile; thus, price fluctuations are common and should be anticipated.
In conclusion, Dash is positioned for potential growth in 2025, driven by its unique features and favorable market conditions. However, it's essential to stay informed about regulatory developments and market dynamics when considering investment decisions.
DASHUSDT 1D#DASH recently broke above the descending resistance and is now breaking above the MA50 on the daily chart. Keep an eye on the Ichimoku cloud. In case of a breakout above it, the targets are:
🎯 $30.51
🎯 $38.37
🎯 $44.72
🎯 $51.08
🎯 $60.12
⚠️ Use a tight stop-loss.

DASHUSDT 2D AnalysisDASH ~ 2D Analysis
#DASH If you still have a Conviction on this Coin, Maybe this support block you can consider to start buying back from here with a short -term target of at least 15%+.

DashUSDTRSI indicates Bullish Divergence. Which means that at any time the market trend can change to HH and HL.


No DASH anymore!I believe that DASH will no longer be able to maintain its value if it loses this support zone.


DASHUSDT 1WDASH ~ 1W Analysis
#DASH Support that you might be able to consider to start buying back from here with a minimum target of 20%+.
Reason, This is the lowest support for now.

DASHUSDT 1WDASH ~ 1W
#DASH If you still have Conviction on this coin,. buy gradually on this support block with a target of at least 20%+

DASH USDT💰 #DASH NASDAQ:DASH
Dash ( NASDAQ:DASH ) is breaking out of a symmetrical triangle pattern, indicating a bullish continuation setup 🚀. With strong support around the Fibonacci 0.786 level, the price is poised for a significant rally.
Enter positions near the $40-$44 range during retracements.
Stop Loss: Below $36 to manage downside risks.
Targets:
🎯 Target 3: $85.46

DASHUSDT: Is a Big Move Brewing? Yello, Paradisers! Are we on the brink of a significant breakout or another leg down for DASH? Let’s dive into the chart and uncover what’s next for this coin. Stay sharp this analysis could save you from making the wrong move at the wrong time.
💎#DASHUSDT is currently approaching a key support level around $30.87, a zone that has consistently acted as a springboard for bullish momentum in the past. This level has been tested previously, showing signs of strength. However, if the support fails to hold, it could spark a cascade of selling pressure, potentially dragging the price down to the next lower demand at $25–$26.
💎Currently, the price is under the influence of a descending trendline, with repeated rejections clearly visible. This pattern has kept the bearish structure intact, making a breakout above this trendline a crucial signal for any shift in momentum.
💎A failure to hold the demand zone at $25–$26 could trigger a sharp move downward, leading to bullish invalidation with bearish targets around $16–$20. This would bring #DASH to an untested historical support level and possibly lead to a liquidation event, clearing out weak hands from the market.
💎The RSI, currently in a neutral range, will be critical to watch. A move above 50 on the RSI could support a bullish breakout, while a drop below 40 would reinforce bearish sentiment.
The market is at a tipping point, and taking action without confirmation at this stage could lead to unnecessary losses. Stay patient, disciplined, and wait for clear signals before taking action.
MyCryptoParadise
iFeel the success🌴

Trading opportunity for DASHUSDTBased on technical factors there is a Buy position in :
📊 DASHUSDT
🔵 Buy Now
🪫Stop loss 42.30
🔋Target 46.35
📏 R/R 2,5
💸RISK : 1%
We hope it is profitable for you ❤️
Please support our activity with your likes👍 and comments📝

DASH ready for more bullish actionhi traders
Dash looks great here.
A higher low on the daily time frame is confirmed.
Easy to strategize the trade.
Risk-reward ratio: 2.65
Entry, target, and stop loss are shown on the chart.
Good luck

DASH - USDT UPDATE on 4th January 2025... Where's it off to?Technical analysis hints a downturn... but I've got this "hunch" in my "stomach" that it could actually go up... Do you see my dilemma?
Tread carefully and don’t rush...
Sometimes, it’s smarter to look for other chances instead of jumping into a "half-baked" trade...
Take it easy... You've got the whole year to play the trading game! ;)
PS: here’s a printer-friendly "KISS" chart... and just so you know... leverage *10 on Binance is the way to go... ;)

DASH/USDT - (25-12-2024) G-Money's short version analysis basedDASH/USDT G-Money's short version analysis based purely on technical analysis only, no nonsense or "BS". I do totally ignore any fundamental analysis, technical analysis only
DASH/USDT still kinda on the "move" waiting for a signal to TP. Trade was open with 10X leverage & should bring *2 account size...Who did enter this trade congratulations! Who missed it... See you all next time! ;)
What do you think?
Chart is itself explaining. Kept a "KISS" approach all the way ( "Keep It Simple, Stupid") & beginners friendly... ;)
I do hope that nobody ignoring SL ( Stop Loss) ! Without it, It is a fastest way to loose hard earned money...
;)
Trade safe & don't do "gambling". In the end it never pays, not worth it to risk loose all your $...
PS: above technical analysis is done for the community & educational purpose only! It is not a financial advice. Just share my very own insight to it.
Merry Christmas to ALL !

DASHUSDTTrendline Break: A break above a significant downtrend line signals a shift in market sentiment from bearish to bullish. This is a key technical signal that buyers are starting to gain control.
