Bulls start offense
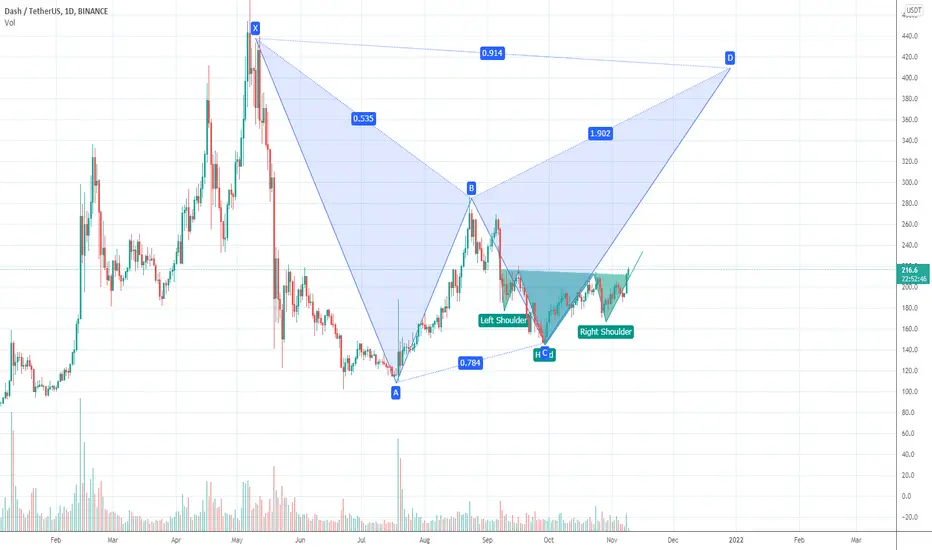
dash not only has a bullish harmonic pattern
Head and shoulders
Bulls start offensive immediately
DASHUSDT trade ideas
✅DASHUSDT - Rushing DASH hit our TP -
Congrats! You must have a nice profit right now if you're following the trading strategy as below
-
As usual, do not forget to take profit at every TP gradually, you can hold the rest until TP1/2 or even TP3.
Just take it anytime you satisfy.
-
Moreover, I set two new SL which are $200.8 and $185.2 to protect your unrealized profit.
Choose any one depend on the risk you wanna take.
Have a good day!.
-
If you like this analysis, smash the like button and leave a comment below to share your thoughts
or let me know what crypto you want to see!
Trading is a reflection of yourself. Learn more daily and be ready for every opportunity.
Have a nice trading!

DASH Breaking downtrendFinally Dash breaking with strength the downtrend
TP1 -> 270$
TP2 -> ATH
SL -> 170$

DASH indicates for a greet bullish!!
In daily timeframe, Consolidating in Symmetrical Triangle Pattern..
At this Moment we Expect Upside will Breakout and this indicate to an explosion in price💣
Buy Some before it's too late
Hope this analysis is useful for u💙
Follow me to get all the news and don't forget ur like
Good luck!✨

Analysis dashHey guys
Can if breaks the high of channel it could moves to selected areas
Enter the trad with low risk powerful break and buy it in pullback

DASH to $500#DASHUSDT
$DASH broke out descending resistance and confirmed it as support.
long term target can be around $500.

DASH try to break out triangle#DASHUSDT
$DASH try to break out from triangle.
wait for it and rebuy in pullback.
target of triangle will be something between $300 and $350.

Dash bull 300%I have no illusions that we will surpass the peak of 17, but this year's peak is a real goal. 200-300%
last year we made 600 percent from November 5th. this was our bottom. this year our bottom was July 16. If we do the same, then we still have the potential of 300%
my dream is 1000 dollars.
To be realistic - $ 700


DASHUSDT : Double bottom in the wedge In 4h chart
It still converging in the wedge but it broke out the blue short downtrend .
If price break out the neckline and stand firm,it make double bottom completed ,trading strategy as below .
SL: 185.2
TP1: 214.1
TP2: 232.5
TP3: 240.0
TP4: 248.0
TP5: 256.0
TP6: 281.9
If you like this analysis, give it a like or share your thought or let me know what crypto TA you want to know.

DASH | Huge Breakout Coming..!!#DASH/USDT (Update)
In daily timeframe, Consolidating in Symmetrical Triangle Pattern..
At the Moment, On the Verge of Breakout, Expecting Upside Breakout📈
Buy Some & Hold it for Midterm..!!
Please like the idea for Support & Subscribe for More ideas like this and share your ideas and charts in Comments Section..!!
Thanks for Your Love & Support..!!

DASHUSDTHello everyone 😃
Before we start to discuss, I would be glad if you share your opinion on this post and hit the like button if you enjoyed it !
4 hr analysis

DASH - Future Projection SeriesIf you’ve read any of my previous “Future Projection” posts, skip down to the conclusion as these paragraphs are the same.
During the downturns in the market I spent time learning more about utilizing the charting functions in TradingView. I also watch a lot of youtube vids about crypto and charting concepts. I came across a good chunk of info on using the “log” function and what it could possible show me.
At this point in the crypto cycle, even though I feel we are nearing a parabolic stage, it is beyond the point to expect 50X or more from me or any basic Joe who “dabbles” in crypto investing. Think long term. What can I realistically (if that even exists in Crypto) expect a coin to perform in the next bull run. Well the log function gives me a level playing field to do just that.
Using the log function, I utilize a common start date as the beginning of my parallel channel. That date is the big drop Mar/20. The parallel channel runs from the bottom of the Mar/20 drop forward in time along the bottom dips. The top of the channel is the highpoint in the cycle.
The first future projection is created using the green trend lines, the first from the top of the cycle peak to the bottom, and another from that lowest point up forward in time to what I estimate as the timeframe for top cycle which approximates end of Q4, and my birthday Jan/7 so thats the future date for all graphs in this series.
The second future projection takes ratio’d growth into consideration. This is done using the blue trend line which starts at the first peak after the Mar/20 drop, using the top of arcs as the guidance. I carry this line forward to Jan/7.
Conclusion; At the time I drew this one the price was $1.98
First Projection $984
984 / 1.98 = 5 X
Second Projection $1,469
1,469 / 1.98 = 7.4 X
Now for a regular old fellow such as myself, a 5 to maybe 7 X on my money within the next few months is a good investment. It literally involves 2 trades. Timing is not a great big deal as long as you get in near 1.98 otherwise the X factors changes a lot. Timing to get out is the top of the curve. This is a day time factor. It’ll be “at the top” for days or a week. You’re not chasing a pump or a knife here, its a month(s) trade. Or a parabolic week so watch close.
I’ve done this for a lot of coins now and the results are sometimes very interesting in that, a popular coin just doesn’t have the numbers or that it really has good numbers. I found as an average I like results in the 5 or above range for the first projection and 15 or above for the second projection. If I utilize this investment concept and choose coins with similar numbers I can reasonably expect a 10-15 X overall. I’ll post a few others I find interesting for this bull run in the coming posts.
My thoughts, not advice Oklah. Cheers

Dashusdt chart patternDashusdt chart pattern
If price can break through the downtrend line, trading strategy as below.
Take some profit at Optional TP if price break the line in the lower part of chart.
Profit Targets:
a) 213.7 Optional TP
b) 232
c) 247.3
d) 255.2
Stop losses:
a) 176.3-----Red horizontal ray

DASH - rocket at the start 😮🚀🚀A trend line has formed on the DASH chart. The price has already tested this trendline 5 times, with each test the resistance is weakening and a breakout may occur soon.
In addition, it is worth noting that the price is contracting and moving in small candles, which is also a signal of accumulation of strength before a breakout.
And of course don't forget to subscribe to our tradingview and other platforms, leave the name of the coin you want us to analyse in the comments. 💚

DASHUSDT - Buy after the timing showedBYBIT:DASHUSDT
4H trend chart
-
DASH is consolidating since falling from M pattern.
Now it is converging and accumulating.
If price can break through the downtrend line, trading strategy as below.
*Take some profit at Optional TP if price break the line in the lower part of chart.
-
Profit Targets:
a) 213.7----Fib(1)/Optional TP
b) 232~239.4----Fib(1.272~1.382)
c) 247.3----Fib(1.5)
d) 280.9----Fib(2)
Stop losses:
a) 176.8-----Red horizontal ray
-
If you like this analysis, smash the "like button" and leave a comment below to share your thoughts
or let me know what crypto you want to see!
Trading is a reflection of yourself. Learn more daily and be ready for every opportunity.
Have a nice trading!


DASHUSDTHello Crypto Lovers,
Mars Signals team wishes you high profits.
We are in a daily time frame.
As you can see, the price is fluctuating on the resistance line, and if it stabilizes above that, it can touch our target.
You can see the reverse head and shoulder pattern that can project a rise in price. We have drawn a support line that if the price drops below it, we predict a fall.
Warning: This is just a suggestion and we do not guarantee profits. We advise you analyze the chart before opening any position.
Wish you luck

DashViews on the medium and long-term trend of Dash
Harmonic patterns appear
Great upside potential in the future
Don't forget it

DashusdtHi Dear followers,
I think this will be Dash's Path. Details can be seen on the chart.
Wish you all luck and Profit.
all the best

Beautiful dash chartThis is just my opinion, please do not buy and sell with my analysis
In my opinion, buying a dash between 190 and 170 seems good, but be sure to buy step by step, and be sure to follow capital management when buying any currency.

#DASHUSDT Daily Chart
Price is ranging in a beautiful ascending channel currently bouncing from the support line. All indicators are neutral, however i expect price to keep moving upwards all the way to the 4h supply at around $250. If no rejection is seen at that level then we would aim for the daily supply at around $300 firstly then the highs at around $410.

Will DASHUSDT fall based on this Rising Wedge?!This is more of a lesson of rising wedge than a analyses if it go as planned (don't let the name decieve you! LOL)
the starting point and TP are on the chart.
