DASHUSDT trade ideas


DASHUSDT1st scenario: If it can break the resistance line It has the potential to increase up to around 240.
2nd scenario: In case it cannot break the line it may go lower than the current support line (strong support). In my opinion, this is less likely to happen since BTC is currently is in a steady-state (will not reduce more and may increase beyond 70k).
This is just a personal idea.
Let's see what will happen :)
DASHUSDT Support And ResistancesThe analysis I make is just an idea not an investment advice. Please manage your risk while trading and please make your investment decisions only by yourself.


dashdash has a canal. it brakes it to up it will make new records if it falles it can go till mide line


Crypto|DASH/USDT|Long and shortLong and short DASH/USDT
Activation of the transaction only when the blue zone is fixed/broken.
The author recommends the use of anchoring fixed the blue zone, this variation is less risky.
If there is increased volatility in the market and the price is held for more than 2-3 minutes behind the activation zone after the breakdown, then the activation of the idea occurs at the prices behind the activation zone.
Working out the support and resistance levels of the consolidation zone.
* Possible closing of a trade before reaching the take/stop zone. The author can close the deal for subjective reasons, this does not completely cancel the idea and is not a call to the same action, you can continue working out the idea according to your data, but without the support of the author.
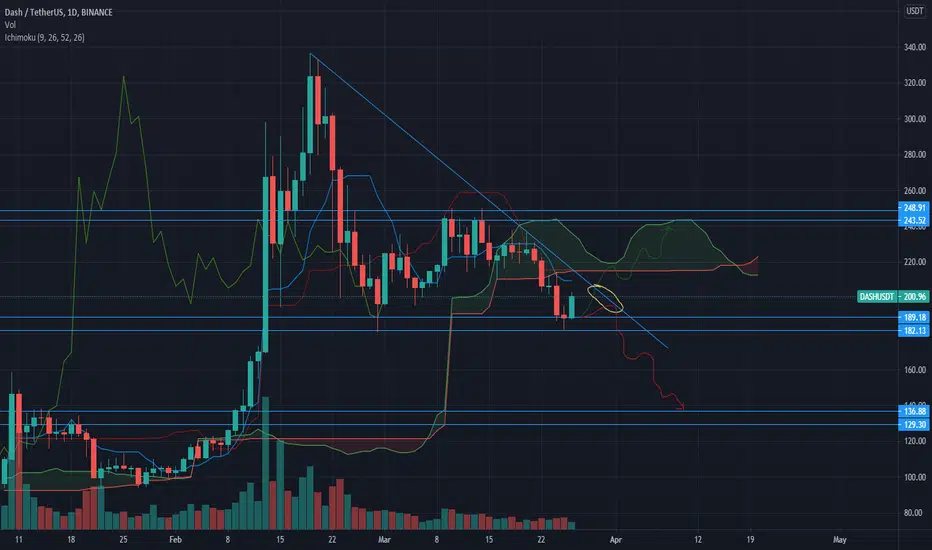
+ ! - zone highlighted by the ellipse is a zone of increased resistance, in this area there is a possible reversal for a correction, please take this factor into account in this transaction.
The "forecast" tool is used for more noticeable display of % (for the place of the usual % scale) of the price change, I do not put the date and time of the transaction, only %.
The breakdown of the upper blue zone - long.
Breakdown of the lower blue zone - short.
Working out the stop when the price returns to the level after activation + fixing in the red zone.
Blue zones - activation zones.
Green zone - take zone.
Red zone - stop zone.
Orange arrows indicate the direction of the take.
Red arrows indicate the direction of the stop.
Priority - The value of the priority parameter implies the author's subjective opinion about the more likely activation zone on this idea, this does not mean that this idea will be 80% activated by this parameter, the purpose of the parameter is to provide for the risk of the inverse of the zone parameter.
Example: "Priority Long: So the author inclines more in the direction of the activation zone open long trades, in this case, when reaching the activation zone in short you should be very careful, because this area may be highly likely to be punched about the breakdown/do not get to take/activate transaction from go to stop."
Please consider this parameter if you use my ideas.
SUM PNL: This parameter displays the total % of all closed ideas of the "new" format (according to the author) for this sector at the time of publication of the idea. The calculation is very "clumsy" just the sum of the profits of all the ideas, based on this indicator, you can more accurately assess the risks when working with my ideas of this sector. I present you the construction of the idea, you can use it yourself as you like based on your subjective view and risks, the calculation of the PNL indicator is carried out only on transactions that the author closed on TV in manual mode or by take.
P.S Please use RM (risk management) and MM (money management) if you decide to use my ideas, there will always be unprofitable ideas, this will definitely happen, the goal of the system is that there will be more profitable ideas at a distance.

DASH/USDT : Trading plan for a buy ....Points to consider
_ waiting for opportunity to buy if the price break the trend line then pullback to ichimoku cloud after the bullish candle get buy position
_ there is a divergence on daily time frame


DASHUSD -LONG SETUPDASH from a daily perspective has now reached a very strong support zone for this market, this zone will have alot of buy orders and demand.Also on the daily market has now printed this nice M formation in which we expect to complete at the neckline giving us our first upside target. Also on the daily yesterdays candle closed in the form of a nice DOJI adding to our confluence. We will be waiting on lower timeframes for market to meet our entry rules, ONLY then we will take the long.


📌DASH buy zone#DASH/USD
📌DASH buy zone
🔹Analytics: the 200$ level is a strong psychological level, breaking the counter-trend line will have a positive effect on the upward plan.
💢Targets:
❌224 $
❌250 $
❌278 $

Potential price action DASH.If DASH breaks to the upside of the Descending Triangle, we may expect the price to reach the target of 320.
Remember: when trading the breakout, wait for a breakout confirmation.
Green= Support
Red= Resistance
Disclaimer: this is not trading advice, trade at your own risk.

Bearish take for DashMost of the people think Dash will break a triangle and go up. This on the table, but right now the long term of Dash is looking quite bearish to me. We are going to close a daily candle about 1 hour from this being posted, and that daily candle closing below the bear flag support line would make it active.
KEEP IN MIND! There is a pretty strong support at the current price level as shown on the chart with the white support line at the triangle bottom. The optimal entry is to short on the break and retest of the support level. So no trade will be active until that happens, and we also need at a 4 hour candle close below this level. The idea can be invalidated with minimal loss if the support level is reclaimed. We are also willing to take the bullish side of this trade if the triangle shown in white from the smaller time frames can be broken to the upside.
Low risk, high reward, low probability to succeed.

DASH ready to explode!The bears failed to break down the support at around 200 usdt level. The Bulls will now take over and send DASH to the Moon!

RSI Divergence on DASHFirst target will be 222 because it is a really string resistance but Consolidation above 222.5USDT would show us a Strong movement. after that 227 , 230 , 236 can be achieved.


