DASHUSDT trade ideas

DASH/USDT - Two upward patterns 🚀Hello everyone, analyzed the DASH / USDT pair
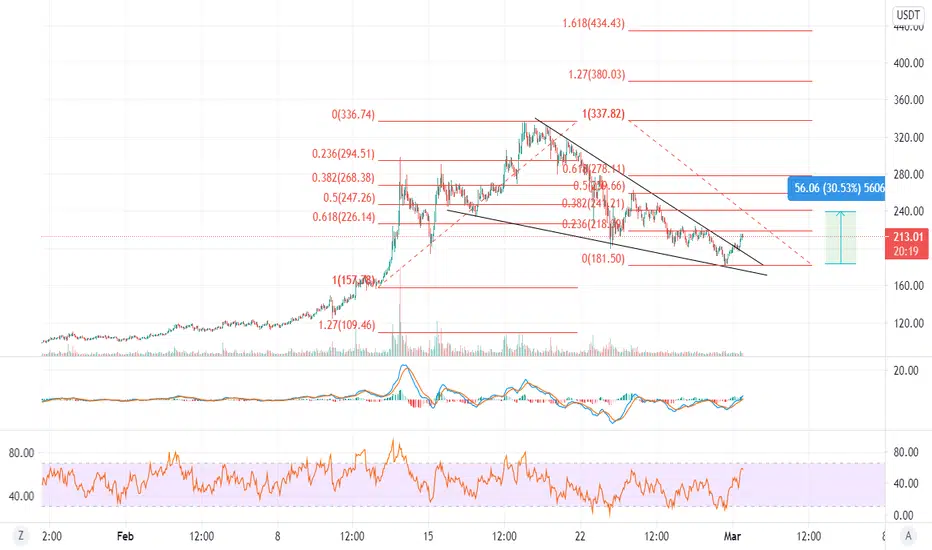
🚀Price was in a falling wedge and moved well, forming an inverted HEAD AND SHOULDERS.
Now there are good savings, I look forward to an impulse movement.
Support zone Level: $ 184-197
Resistance zone levels:
$ 232-247
The levels of work are indicated on the graph. Don't forget that this coin gave a nice boost to your deposit. This is impulsive and you shouldn't take short stops.
"This is just my opinion, trade with your trading system."
"Have a nice day everyone and come."


DASHUSDTPERP - Long - Potential 15.21%DASHUSDTPERP - Long - Potential 15.21%
Entry- 228.06
TP1- 237.03
TP2- 263.08
SL- 210.20
- Trigger - Pullback
- BTC - Price Rising - Alts rising
- RR - 2
- Trailing Buy - 1%
- Trailing Profit - 1%
- Trailing Stop-Loss - no


DASHUSDT long Risk warning, disclaimer: the above is a personal market judgment based on published information and historical chart data on Tradingview, all analysis is only subjective. Hope investors consider, I am not responsible for your investment decision. Thank you.
Good luck!

🆓Dash/USDT Analysis (2/3) #DASH $DASHThe selling pressure was stopped and DASH is recovering quite fast, this can help DASH in making a new rally up to 280$ zone or even 400$ zone. But at first, DASH must conquer 240$ zone, this zone is very important to DASH at the moment
If DASH loses this round number support zone at 200$, it will dump strongly to 120$ zone
📈BUY
-Buy: 200-210$. SL if B
-Buy: 235-245$ if A. SL if B
📉SELL
-Sell: 275-285$. SL if A
-Sell: 390-410$. SL if A
♻️BACK-UP
-Sell: 200-210$ if B. SL if A
-Buy: 120-130$. SL if B
❓Details
Condition A : "If 1D candle closes ABOVE this zone"
Condition B : "If 1D candle closes BELOW this zone"

DASH Buy oppotunity 4H#DASHUSDT has a good support on 200 - 205 $ and short term downside trendline is broken .
As you can see on the chart we have 2 positive divergences with price on MACD and RSI .
so we can say Dash is going to begin a new uptrend.
for short term trade we can have 245 - 290 and 330 targets.
and if it breaks 330 resistance then we could have 600 - 1300 and 2200 targets for mid term and long term .
Like and comment if you agree or disagree with me please.
***Future is yours***


DASHUSDT (DASH) - UPTREND CONTINUATION ANALYSIS 🔎
- DASHUSDT brokeout above the falling wedge's (FW-1) resistance and hit a swing high.
- Price then retraced for a retest of the flip horizontal support and 0.618 fibonacci retracement level.
- RSI is printing a bullish divergence signal.
- The retracement is bounded in a falling wedge pattern (FW-2).
- A falling wedge pattern is a bullish reversal pattern.
- A breakout above the falling wedge's (FW-2) resistance could be an uptrend continuation signal.
BUY ENTRY ⬆️
- Breakout above the falling wedge's (FW-2) resistance.
TARGETS 🎯
- Horizontal resistance level (R1).
- Horizontal resistance level (R2).
- Fibonacci extension levels.
SETUP INVALIDATION ❌
-Breakdown below the falling wedge's support.

🔥Falling Wedge DASHSupport the idea with like!)❤️
#DASH/USD
📌Falling Wedge DASH
🔹Analytics: The asset is in a falling wedge, a breakout of the counter-trend will be a good signal for an upward movement, the RSI divergence confirms an upward outcome. I do not give exact points for entry-exit. Resistance lines - possible sell / correction, you can fix part of the position. All goals are shown on the chart. This is just my opinion, it may not coincide with yours.

DASH analysisHi ; DASH will grow up !
DASH is moving in a descending Wedge and I think will grow up.
Do you think so .


My Dash BuyPlease, DYOR.
This is my personals trade idea.
Dash followed BTC in this dip. But SL not hit. Still in play
I will look on how BTC react near the .618 fibb. If BTC want to go down again I will close trade at 284.25.
If BTC want to go over 53k.
target 1 : 373.96
target 2 : 421.42
On this charts using the Buy signal (Green + white diamond) Is Cryptovac. A paid indicator but a seriously strong indicator. I can put you in contact with the Owner.
It also show resistance and support.


DASHUSD- SHORT DASH is following the whole bearish correction in the crypto market, we are now approaching daily and 4hr support. market has formed this massive head and shoulders pattern after failing to make a new high yesterday, waiting for a break below support before looking to short.

