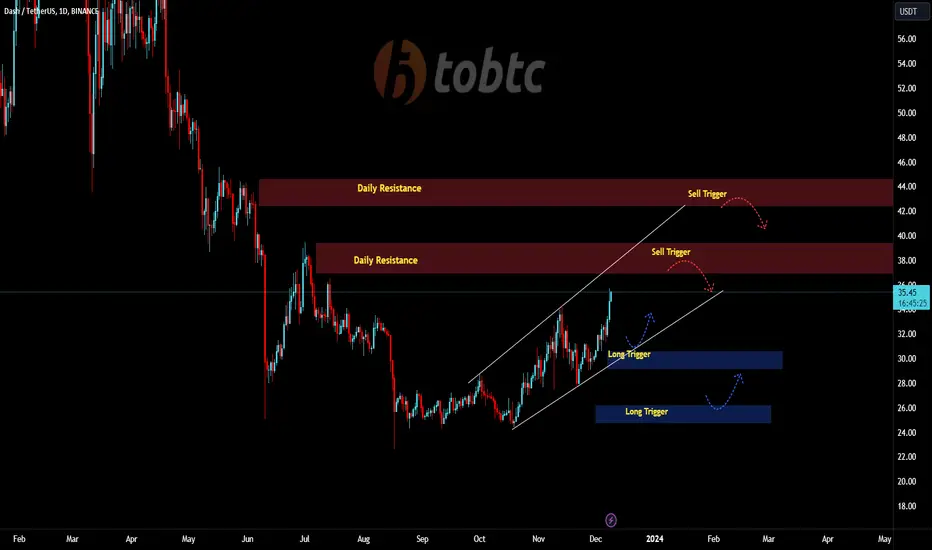
DASH IS BULLISHHi, dear traders. how are you ? Today we have a viewpoint to BUY/LONG the DASH symbol.
For risk management, please don't forget stop loss and capital management
When we reach the first target, save some profit and then change the stop to entry
Comment if you have any questions
Thank You
DASHUSDT trade ideas

DASH Purchase!!!DASH has reached the global bottom!!!Purchase zone 18.17-30.23
Purchase level 25.04
The price of the total volume is 77.99
Volume price 27.51

DASHUSDT IN BEARISH TRENDAt present, DASHUSDT exhibits a bearish trend without any divergence detected. A strategic approach has been taken by employing Fibonacci analysis for a precise market entry. The previous Lower High (LH) has been designated as the Stop Loss level to manage risk. Two distinct profit targets, TP1 and TP2, have been set at 1:1 and 1:2 risk-reward ratios respectively.

DASH/USDT - Dash: TD Sequential◳◱ On the $DASH/ CRYPTOCAP:USDT chart, the Td Sequential pattern suggests momentum building up for a significant move. Traders might observe resistance around 36.84 | 41.97 | 50.17 and support near 28.64 | 25.57 | 17.37. Entering trades at 29.44 could be strategic, aiming for the next resistance level.
◰◲ General info :
▣ Name: Dash
▣ Rank: 168
▣ Exchanges: Binance, Kucoin, Bybit, Huobipro, Gateio, Mexc
▣ Category/Sector: Payments - Currencies
▣ Overview: Dash is a fork of Bitcoin that focuses on the payments use case. It has introduced a number of features to the industry including masternodes, LLMQs, ChainLocks, and InstantSend, which target scalability, speed, reliability, cost-effectiveness, and user experience. The Dash network is also the longest-running decentralized autonomous organization, utilizing on-chain governance to allocate network resources toward projects and organizations that support the network.
◰◲ Technical Metrics :
▣ Mrkt Price: 29.44 ₮
▣ 24HVol: 4,321,670.410 ₮
▣ 24H Chng: 0.65%
▣ 7-Days Chng: -10.91%
▣ 1-Month Chng: -8.13%
▣ 3-Months Chng: 9.58%
◲◰ Pivot Points - Levels :
◥ Resistance: 36.84 | 41.97 | 50.17
◢ Support: 28.64 | 25.57 | 17.37
◱◳ Indicators recommendation :
▣ Oscillators: NEUTRAL
▣ Moving Averages: STRONG_SELL
◰◲ Technical Indicators Summary : SELL
◲◰ Sharpe Ratios :
▣ Last 30D: -0.79
▣ Last 90D: 0.85
▣ Last 1-Y: -0.24
▣ Last 3-Y: 0.18
◲◰ Volatility :
▣ Last 30D: 0.82
▣ Last 90D: 0.63
▣ Last 1-Y: 0.70
▣ Last 3-Y: 1.07
◳◰ Market Sentiment Index :
▣ News sentiment score is N/A
▣ Twitter sentiment score is 0.59 - Bullish
▣ Reddit sentiment score is 0.40 - Bearish
▣ In-depth DASHUSDT technical analysis on Tradingview TA page
▣ What do you think of this analysis? Share your insights and let's discuss in the comments below. Your like, follow and support would be greatly appreciated!
◲ Disclaimer
Please note that the information and publications provided are for informational purposes only and should not be construed as financial, investment, trading, or any other type of advice or recommendation. We encourage you to conduct your own research and consult with a qualified professional before making any financial decisions. The use of the information provided is solely at your own risk.
▣ Welcome to the home of charting big: TradingView
Benefit from a ton of financial analysis features, instruments and data. Have a look around, and if you do choose to go with an upgraded plan, you'll get up to $30.
Discover it here - affiliate link -

🚨 Trade Alert: DASH/USDT (3-5x)🚨 New Trade Alert 🚨
✅ DASH/USDT (3-5x)
📈 LONG Entry Zone: 27.8 - 30.3
⛔️ SL: 26.45
🔒 Breakeven Move: When it moves close to TP2
🎯 Take Profit:
Short Term: 30.6 - 30.9 - 31.5 - 32.1 - 32.9
Mid Term: 33.5 - 34 - 35 - 37 - 39
📝 Ensure you set entry orders to balance the trade's entry and aim to secure 30% of profits within the first two targets. Once profits are gained, adjust the stop orders to match the entry points or break-even levels.
⚠️ Disclaimer: Historical earnings cannot assure future outcomes. Is there a potential for risk? Certainly. The entire financial market is susceptible to uncertainties; any underlying factor or abrupt shift in market sentiment could overturn the current market trends and lead to losses. Refrain from undertaking undue risks that might jeopardize your financial stability. You are under no obligation to engage in this trade; kindly avoid the trade if you disagree with the trade analysis.
GIS TRADING®

DASH USDT (Long Trade Setup)Technical Analysis behind DASH USDT Trade:
1. Supported by the immediate support area & Trendline
2. Long Liquidity Grab candle.
3. RSI is at 40, a very bullish sign.
4. MFI (Money Flow Index) analysis also supports the trade.
5. The stop loss is based on the volatility indicator (ATR)

DASHUSDTmy entry on this trade idea is taken from a point of interest below an inducement.. I extended my stoploss area to cover for the whole swing as price can target the liquidity there before going as i anticipate.. just a trade idea, not financial advise

I am waiting for a smooth approach to the zone SHORT #DASHUSDT SHORT #DASHUSDT from $29.2 stop loss $34
The coin broke through the downward trend without confirmation in the form of volumes and captured liquidity from the previous local maximum, we can observe the price highs pressing along the trend towards a clear support level, behind which there is a large accumulation of stops of retail traders; also, as the price grew, it showed captures of liquidity from local maximums. which confirms the short narrative.
I am waiting for a smooth approach to the zone, the appearance of volumes and activity in the order book before continuing the decline.

Bullish Channel Detected on DASH/USDTAnalyzing the DASH/USDT pair reveals a promising bullish scenario. The price action has formed a clear bullish channel, presenting a favorable opportunity for potential gains.
Trade Setup:
Buy Zone: 32-30.5 USDT
Stop Loss: 29.5 USDT
Take Profit: 38 USDT
Rationale:
The price is currently within an upward channel, indicating a bullish trend. Entering the market within the specified buy zone aligns with the trend, providing an attractive risk-reward ratio.
Risk Management:
A stop-loss at 29.5 USDT is set to mitigate potential losses in case the market doesn't follow the expected trajectory. It's crucial to adhere to risk management principles to protect the trading capital.
Profit-Taking:
The take-profit level is set at 38 USDT, representing a reasonable target within the bullish channel. Adjustments can be made based on individual risk tolerance and market conditions.
Disclaimer:
This analysis is for educational purposes only and should not be considered financial advice. Always conduct your research and consider your risk tolerance before making trading decisions. Past performance is not indicative of future results.

Dash Setup - Short Idea - Trade #001 - Test EntryTrade #001
"Render therefore unto Caesar the things which are Caesar's; and unto God the things that are God's."
Matthew 22:14-22
__________________________________________________________
This is my first public post on Tradingview in several years. I've still been trading; I just haven't posted my setups here, and I had some personal things to tend to. In 2024, I will be back posting 100%.
I threw about 50% of my prior strategy into the trash, and I have switched from intra-day trading to swing trading. It was profitable, but it was too complicated for me to follow clearly. My new strategy is very simple, I lose more but it's much easier on the brain. Here you go:
- Harmonic
- RSI Divergence
- Liquidity-based entry
- Target 38.2% pattern retrace
(Rinse and repeat)
Here is THIS setup:
DASH/USD
Right now this is a test entry, I'm building data on cryptocurrencies as a I look to expand outside of Forex.We have a bearish ABCD, bearish divergence, and liquidity signal.
Stay true,
Gio Pasquale
"A man's life consisteth not in the abundance of the things which he possesseth."

DASHUSDT 🔺Weekly update🔺The third encounter with the weekly trend line and the possibility of failure according to the RSI divergence. After the break and the Pull-back, enter the LONG postion.


TRADE PLAN FOR DASH FOR PROFITSHello guys, i believe its has been a wonderful journey so far with profits , A look into DASH and its plan for profits. ENJOY.
tradehubng

DASH ANALYSIS🔮 #DASH Analysis : Pattern Formation 💰💰
🤑🤑#DASH is making perfect rounding bottom pattern indicating a potential correction from its lowest point. If #DASH breakout the neckline and also retest the level then we will get a bullish move📈📈
🔖 Current Price: $32.00
⏳ Target Price: $74.00
⁉️ What to do?
- We can trade according to the chart and make some profits in #DASH. Keep your eyes on the chart, observe trading volume and stay accustom to market moves.💲💲
🏷Remember, the crypto market is dynamic in nature and changes rapidly, so always use stop loss and take proper knowledge before investments.
#DASH #Cryptocurrency #Pump #DYOR

✴️ Dash Set To Move Beyond $111.11 (A 580% Bullish Wave) The waThe wave count here is hard to interpret but what is not hard is the Adam & Eve bottom pattern, it is quite clear on this chart (black).
With a perfect 5-down wave pattern, we can expect an upwards correction or full-blown change of trend.
DASHUSDT hit a low in June this year and later bottomed in August; now it is trading above EMA10.
This is another great chart setup, a bottomed out pair has low risk and high potential for reward.
➖ Risk can be low between 20-30%.
➖ Potential can be great between 240%-580% or more if the focus is long-term.
This is not all that is possible for this pair.
A new All-Time High can happen within the next Altcoins market bullish phase.
Namaste.

DASHUSDTI have taken a Long position on DASH, and this is my own idea. This trade is executed on Bybit.

🚨 Trade Alert: DASH/USDT (3-5x)🚨 New Trade Alert 🚨
✅ DASH/USDT (3-5x)
📈 LONG Entry Zone: 30.33 - 32.61
⛔️ SL: 29
🔒 Breakeven Move: When it moves close to TP2
🎯 Take Profit:
Short Term: 33 - 33.5 - 34 - 35 - 36
Mid Term: 37 - 38 - 40 - 42 - 45
📝 Ensure you set entry orders to balance the trade's entry and aim to secure 30% of profits within the first two targets. Once profits are gained, adjust the stop orders to match the entry points or break-even levels.
⚠️ Disclaimer: Historical earnings cannot assure future outcomes. Is there a potential for risk? Certainly. The entire financial market is susceptible to uncertainties; any underlying factor or abrupt shift in market sentiment could overturn the current market trends and lead to losses. Refrain from undertaking undue risks that might jeopardize your financial stability. You are under no obligation to engage in this trade; kindly avoid the trade if you disagree with the trade analysis.
GIS TRADING®

#DashUSDT #LQR #TOBTC #LaqiraProtocolThe price is trying to reach the resistance of 37-40. If reaching this Zone, we are looking for reasons to enter a sell position. If confirmed, enter according to your strategy. This analysis is a personal view and the offer is not buy or sell
DASHUSDT- In Sideways TrendDASHUSDT is in a sideways trend. So applied support and resistance lines to find support and resistance. And to take the short trade set the S2 as the sell Stop and S1 as the Stop loss and calculate the TP. And to take the long trade set the R2 as Buy Stop and R1 as Stop loss and calculate the TP.

DASHUSDT - Breakout from consolidationAfter a strong bullish runup, DASH has been consolidating in a horizontal range.
Low breakout has been rejected so prepare for possible breakout on either side of channel

DASH/USDT Short-Term OutlookTitle: DASH/USDT Short-Term Outlook
Bias: Bullish Reversal
Description: DASH/USDT is forming a base above $28.69, with SMAs converging, indicating a potential reversal. RSI above 40 suggests momentum is picking up.
Direction: Expecting an upward move.
Entry Position: Break above $30.41 (24 SMA).
Stop Loss: Below $28.69 (recent low).
Targets: $31.25 (48 SMA), then $32.70 (resistance).
Caution: If price falls below $28.69, bearish trend may resume. Monitor RSI for strength confirmation.

Dash to $1500On the above 4-day chart price action has corrected 90% since the sell signal back in the Spring of 2021 (not shown). Now is an excellent moment to be long. Why?
1) A breakout from resistance that began in May 2021.
2) Multiple oscillators print positive divergence over a 7 week period. Look left.
3) The target is $1500. Some of you know why some of you don’t.
Is it possible price action falls further? Sure.
Is it probable? No.
Ww
Type: trade
Risk: <=6% of portfolio
Timeframe: Don’t know.
Return: 30x minimum

DASH/USDT Breaking Descending Channel? DASH Analysis💎Paradisers, get ready for a potential trading prospect with DASHUSDT. It's currently exhibiting interesting activity within a descending channel, indicating a possible shift towards an upward trend.
💎DASH has been diligently tracing a descending channel pattern. Should it break above this channel, we anticipate it to target liquidity up to a resistance level, followed by a swift retraction, staying true to its channel pattern.
💎There's a strong likelihood of a bullish movement starting from the support mark around $33.5. Once DASH successfully exits the descending channel in an upward direction, it's expected to aim for resistance levels near $43.17.
💎 Timing is of the essence for astute Paradisers. Identifying the best entry points during this ascent is key, and it's wise to steer clear of entering at the height of the rise.
💎Be cautious, as there's also a chance of DASH descending below the $24.36 support level. A fall beneath this critical point may raise questions about the sustainability of the upward trend.
