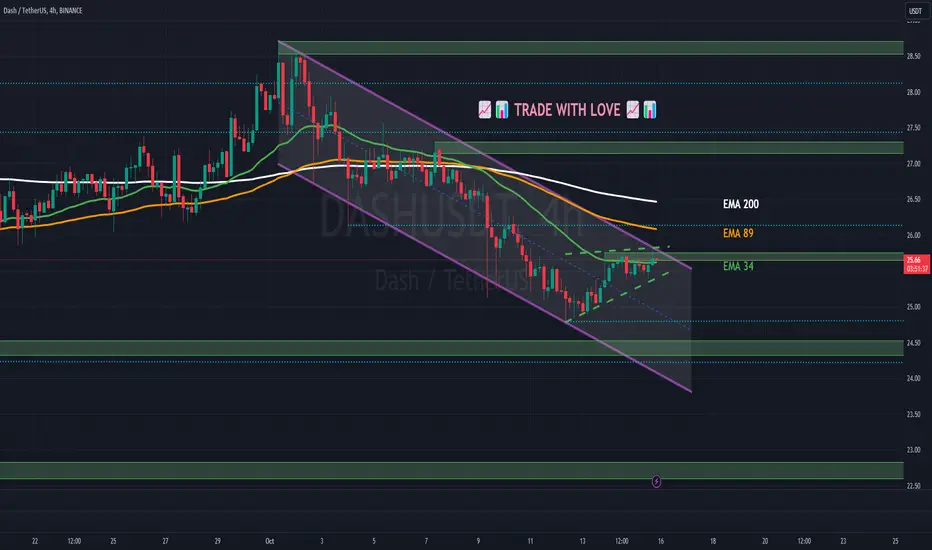
dash preparing for massive recovery seems like dash has already bottomed out and preparing for massive recovery
formed falling wedge and approaching towards multi year trendline expecting breakout soon incase of successful breakout expecting massive bullish rally
incase of successful breakout expecting 180 to 200% bullish wave
DASHUSDT trade ideas

Dash After Successfull Trade Here is The Next One. Welcome to our crypto exploration hub! We're here to navigate the exciting world of digital assets, providing you with comprehensive insights into market dynamics and potential trading opportunities.Our mission is to decode the crypto market's mysteries and equip you with the knowledge you need to make informed investment choices. From the latest developments in Bitcoin to the hidden potential of various altcoins, we're your trusted source for daily technical analysis.While technical analysis is a valuable tool, it's important to remember that it's just one piece of the puzzle. We encourage you to take a well-rounded approach to your investments, considering factors like macroeconomic trends, news, and community sentiment.Join us for the freshest analyses, and don't hesitate to join the conversation in the comments below. Keep in mind that our content is purely for educational purposes and should not be construed as financial advice. Always integrate it into your broader investment strategy."

DASH facing resistance at target 1 butDASH is gaining momentum toward historical trend line and will face resistance. But the project is still going and I see a close above 55 to start great momentum towards next targets.

DASH (Crypto DASH ) Buy TP = 49.64On the 4-hour chart the trend started on Sept. 3 (linear regression channel).
There is a high probability of profit taking. Possible take profit level is 49.64
But we should not forget about SL = 21.77
Using a trailing stop is also a good idea!
Please leave your feedback, your opinion. I am very interested in it. Thank you!
Good luck!
Regards, WeBelieveInTrading

📈📊 #ChartPattern Alert! 📈📊 📈 Triangle 📈A "triangle," in the context of trading and technical analysis, is a chart pattern that forms when the price movements of a financial asset create a shape resembling a triangle. Triangles are typically continuation patterns, meaning they often indicate that the asset's price is likely to continue moving in the direction it was heading before the formation of the triangle.
There are several types of triangles:
Symmetrical Triangle: This triangle forms when the price oscillates between two converging trendlines, one sloping upward and the other downward. As the price approaches the apex (the point where the two trendlines meet), it's expected to break out in either an upward or downward direction, indicating a potential continuation of the previous trend.
Ascending Triangle: An ascending triangle occurs when there is a horizontal resistance level and an upward-sloping support line. This pattern suggests that buyers are gradually becoming more aggressive, and a breakout above the resistance level could lead to an upward trend continuation.
Descending Triangle: Conversely, a descending triangle forms when there is a horizontal support level and a downward-sloping resistance line. In this case, sellers are becoming more aggressive, and a breakout below the support level could indicate a continuation of the downward trend.
Traders often use triangles to identify potential entry and exit points for their trades. The breakout direction from the triangle pattern is seen as a significant signal. However, it's essential to consider other factors, such as volume and overall market conditions, to confirm the validity of the breakout.
In summary, a "triangle" in trading represents a chart pattern formed by converging trendlines, indicating a period of consolidation in the market. It's a useful tool for traders to anticipate potential price movements and make informed trading decisions.

✴️ Dash Reversal, Aims At $60 (Name Your Altcoin)We are looking at it up close to spot the reversal which is what's most relevant right now. Or I should say the "potential" for a reversal because things can always change.
This is Dash on the daily timeframe, DASHUSDT.
Dash produced a low in June 2023 followed by a lower low in August.
The current daily session trades above both these lows with the June low being more important as it is higher.
Dash is also trading daily above EMA10.
These simple yet powerful signals indicate that there is bullish potential for this pair.
Even though the price is weak;
Even though the pair is trading near support;
Bullish potential means that it can grow not that it is trading at new highs or all-time highs.
For example, a weak/oversold RSI is a bullish signal because there is potential for a reversal.
I am mentioning this because some people read it the other way around.
Now, these signals are supported by a strong bullish divergence with the MACD and RSI, see the charts below.
These oscillator are producing higher highs while the pair produced lower lows...
MACD (higher low since August-June)
RSI (higher lows October-August-June)
And so we have potential for a reversal to take place.
Looking at this in isolation can be tricky and thus we consider the rest of the market, meaning Bitcoin as well as some conventional assets like Gold and the DXY.
Bitcoin is bullish and hitting new daily highs.
Gold is bullish and positively correlated with Crypto while the U.S. Dollar Index (DXY) which is has a negative correlation is bearish. There you have the entire soup.
The Altcoins are bullish as well.
Looking at the entire picture together leads us to the conclusion that Dash too can also develop a new bullish wave.
$60 can be the next target... Higher or lower?
Who knows... Who cares!
Thank you for reading.
Namaste.

📈📊 #ChartPattern Alert! 📈📊 📈 Channel 📈A "channel," in the context of trading and technical analysis, is a chart pattern that forms when the prices of a financial asset move between two parallel lines, creating a kind of corridor or channel. There are two main types of channels: an ascending channel and a descending channel.
Ascending Channel: This channel forms when prices have an overall upward trend, but this trend is contained within two upward-sloping parallel lines. The lower level is the support, where prices often find buyers, while the upper level is the resistance, where sellers may come into play. Traders often view the ascending channel as a sign of the continuation of the existing uptrend.
Descending Channel: On the other hand, the descending channel forms when prices have a downward trend, but this trend is bounded by two downward-sloping parallel lines. The upper level is the resistance, where prices tend to retreat, while the lower level is the support, where minor bounces may occur. Traders typically interpret the descending channel as a sign of the continuation of the downtrend.
Channel analysis is an important tool for traders as it can help identify entry and exit points, as well as set profit targets and stop-loss levels. However, it's crucial to note that channels are not foolproof, and prices can break beyond the channel lines, signaling a change in trend.
In summary, a "channel" is a chart formation that depicts the direction and strength of a price trend in a financial asset. It's a useful tool for traders looking to make informed decisions about their market trades.
Establishing Bias (Dash TetherUS)More on estabilishing bias on the daily chart rather than anything specific, you can watch until a few minutes when I reach into the hourly chart, but only up until there for now as I don't have any specifics yet.

DASHUSD ❕ decline50EMA broke down 200EMA (4H TF)
RSI is moving in a bearish zone.
I expect the decline to continue.


22/9/2023 DASH SHORT IDEASDASH is doing Sideways. Should have ENTER short at Resistance (27 - 27.15+ -) by using Support and Resistance.
But after Connecting the high of candles with Trendline. This trendline act as a resistance for now. So I decided to short at GREEN TL with tight stop loss.
Entry: 26.40 (Market)
TP: 25 - 25.1
CL: 1.5-2% Above GREEN trend line

DASH/USDT upward momentum?? 👀 🚀 DASH Today Analysis💎 Paradisers, take note! DASHUSDT is presenting an exciting opportunity as it seems to be gearing up for a bullish move, maintaining key support.
💎 For the past few weeks, DASH has been trading within a confined range and is now on the brink of breaking out of a strong descending trendline that has been acting as resistance. Above, there is a clear supply zone and imbalance. It's highly probable that the price will mitigate that level shortly.
💎 However, there’s another scenario to consider. If the price breaks below the support, a significant downward move is expected. In the case of a downward continuation, plan your short entry wisely, keeping a 1.75% stop loss in both scenarios.
💎 In the dynamic world of crypto, staying informed and adaptable is key. Stay vigilant and trade smartly!

DASHUSD ❕ rebound Trading volumes remain stable.
RSI is near neutral values.
DASH has fixed above the 200EMA (4H TF)
I expect that the asset will rise after fixing above the resistance.

DASH : some good reaction to fibo 61.8Today I will send you some good tokens that react to the 61.8 fibo.
According to the chart, if you see the entry trigger and the confirmation candle, you can enter the position.
It will be very useful to have a minimum knowledge of technical analysis in the market for better use of these analyses.
In the end, don't forget capital management and compliance with risk to appropriate reward.
Good luck and profitable.

DASH USDT PERPHello Trader OKX:DASHUSDT.P
this bounce area has not rejected to be tracked if it is lined up on the close of several 1-hour candle sticks. if it rejects down, it means that the long area is not valid. so this is the closest scalping area.
Please add a comment and Positive feedback and
constructive criticism are important to authors and the
community.
Disclamer: Not Financial Advice
all leverage 20X

DASH USDT PERP Hello Trader OKX:DASHUSDT.P
This pair is experiencing market price weakness, as it rejects the resistance area and continues for a sustained bearish phase. entry and take profit areas have been marked by me good luck.
Please add a comment and Positive feedback and
constructive criticism are important to authors and the
community.
Disclamer: Not Financial Advice
all leverage 20X

DASHUSDT Buy Limit Dash is in a strong uptrend, bullish OrderBlock is at 26.00 level SL 25.88 Risk Reward 1/3 or more , depends on the situation.


DASHUST is a convenient entry pointHello everyone! According to DASHUST, I sketched out approximately the levels and the whole picture. It was possible to enter the coin well in early August, when the price hovered above the support level of 30 USDT. But now it is also a more or less good entry, since an inclined trend line covers the coin from above. Well, the logical goal is the next level of support at 20 USDT. And considering that there is no change in the trend, I will be waiting for a coin at these marks in the near future.

DASHUSD ❕ tests the supportDASH broke upwards through 50EMA (4H TF)
RSI chart indicates the initiative is shifting to the buyers (4H TF)
50EMA broke up through 200EMA (1H TF)
I believe that the asset will continue to rise after fixing above the support.

DASH / DASHUSDTDASH in good point for entry
GOOD LUCK
• Warning •
Any deal I share does not mean that I am forcing you to enter into it, you enter in with your full risk, because I'll not gain any profits with you in the end.
The risk management of the position must comply with the stop loss.
(I am not sharing financial or investment advice, you should do your own research for your money.)

DASH/USDT is Ready For its Next Bullish Rally | DASH Analysis 💎 DASH is painting an optimistic landscape, particularly with its recent upward break from the descending wedge pattern.
💎 At the moment, DASHUSDT has tested its pivotal support and is charting an upward course.
💎 However, the POC of VRVP is acting as resistance, potentially pushing DASH to revisit its support zone.
💎 If DASH breaches its demand zone, a continued descent might be on the horizon which has minor chances. We are hopeful that DASH will continue its bullish rally.
💎 In the dynamic world of crypto, vigilance and staying updated are crucial. Keep a close watch and stay informed.

DASHUSD ❕ descending wedgeDASH broke upward through a descending wedge.
I believe that the asset will continue to rebound after fixing above the resistance level.
