DASHUSDT trade ideas


#DASHUSDT #LQR #TOBTC #LaqiraProtocol● Price is below dynamic resistance and EMA 60&200 • Important support and resistance are specified in the chart.
• Levels are obtained from the intersection of the fib and static levels
• You can open a position after confirmation
• This analysis is not an offer to buy or sell


#DASH Remains Bullish, Support at August 2022 High At $58Past Performance of DASH
DASH prices have more than doubled at spot rates. Changing hands at over $60, the coin is within a bullish breakout formation. The rejection of lower prices as bulls force prices higher above last week's highs point to demand and confidence on buyers' part. The uptrend is firm as long as DASH is trading above August 2022 highs.
#DASH Technical Analysis
Traders are confident. After yesterday's surge, and rewinding losses of the weekend, the uptrend formation has been confirmed. Subsequently, traders may find entries on every dip inside the February 6 trade range but above $58 to buy the dip. Based on this candlestick arrangement, the next target will be around $75 or May 11 high. Conversely, losses below August highs may force a sell-off toward $50.
What to Expect from #DASH?
DASH has been firm in the past three months, bottoming up from 2022 lows. In a bullish breakout formation, traders expect even more gains ahead. Nonetheless, this preview holds water only if $58 holds and DASH rejects any attempt of lower lows.
Resistance level to watch out for: $75
Support level to watch out for: $58
Disclaimer: Opinions expressed are not investment advice. Do your research.


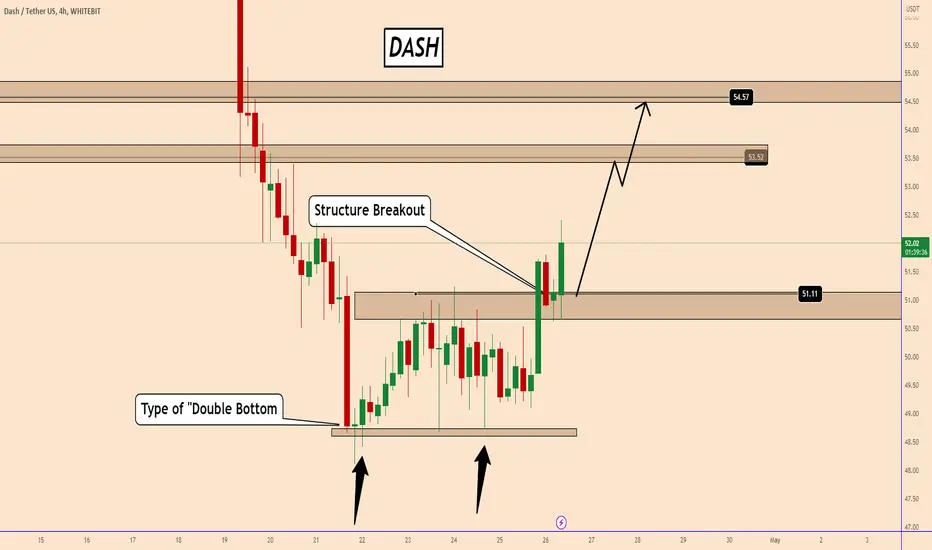
DASH: An Ugly Double Bottom PatternDASH: An Ugly Double Bottom Pattern
DASH completed an ugly double bottom pattern.
Today the price confirmed this pattern with a strong bullish volumi
that was support from the crypto market overall.
The bullish sentiment can help the price to rise further up to 53.50 and 54.50
#DASH Recovers after Dropping 11%, Support Lies at $55Past Performance of DASH
Like the rest of the markets, DASH prices are recovering, pushing higher at spot rates. This follows a cool-off from March highs that saw the coin drop 11%. Presently, the immediate support line lies at around $55. Since yesterday's bar is wide-ranging and bullish, traders may look to accumulate on every attempt. However, more opportunities could be above BMV:60 , opening the door for continuation above HKEX:65 in the days ahead.
#DASH Price Analysis
The retracement from HKEX:65 was with light volumes after a sharp leg up from mid-March. With DASH finding support at HKEX:55 and rebounding higher in a three-bar formation, traders can look for opportunities. Since yesterday's bar has high volumes, there are hints that price action is aligning with buyers from mid-March. Accordingly, traders can begin buying on dips, in line with buyers of March 12 and 13, with targets at the climactic bar of March 23. Any unexpected retracement below HKEX:55 cancels this preview, even forcing DASH toward $50.
What to Expect from #DASH?
DASH prices may be in the early stage of recovery after a cool-off from March peaks. Even though prices may push higher, it is ideal that the push is with expanding volumes to support optimistic buyers. A close above BMV:60 may be ideal, founding the base for HKEX:65 in short to medium term.
Resistance level to watch out for: BMV:60
Support level to watch out for: HKEX:55
Disclaimer: Opinions expressed are not investment advice. Do your research.


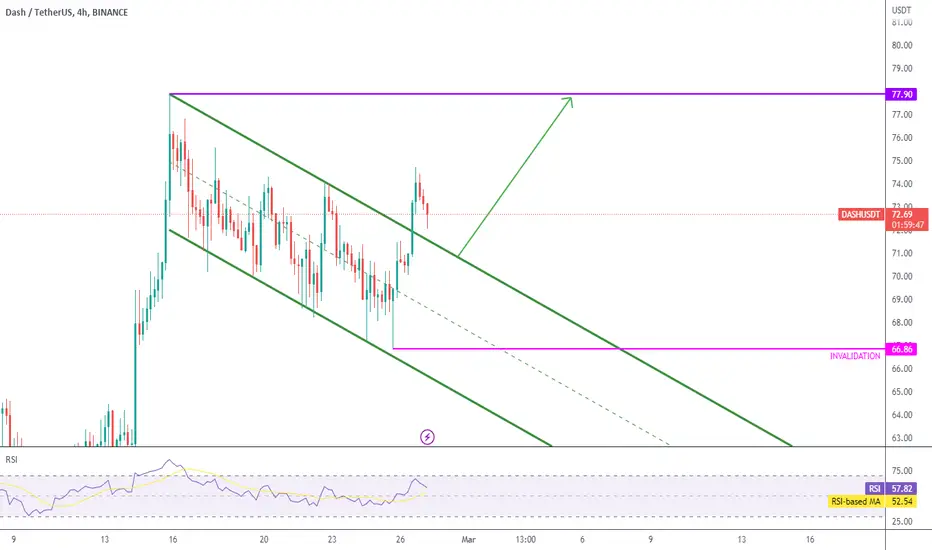
DASHUSDT is testing the key levelDASHUSDT experienced a false breakout above the 4-hour resistance at the $64 level.
This level coincided with the static 4-hour resistance at the 0.618 Fibonacci resistance, indicating a strong level of resistance. However, the price was not able to sustain the momentum and has since retreated, testing the support level once again.
If the price fails to hold above the support level, there could be an opportunity for traders to set a short order, according to Plancton's strategy. This would be based on the assumption that the price may continue to move lower, potentially breaking through additional support levels.
–––––
Follow the Shrimp 🦐
Keep in mind.
🟣 Purple structure -> Monthly structure.
🔴 Red structure -> Weekly structure.
🔵 Blue structure -> Daily structure.
🟡 Yellow structure -> 4h structure.
⚫️ Black structure -> <= 1h structure.
Follow the Shrimp 🦐

#DASH Uptrend Valid Despite 30% Correction from February HighPast Performance of DASH
Following steep losses on March 15, DASH remains under pressure. The short-term trend is bearish, and prices are inside a bull flag. For this to change, prices must break above the descending channel, piercing above $60 with increasing participation.
#DASH Technical Analysis
DASH is within a bear formation at spot rates. As it is, resistance remains at $60 while support lies at $45. Though the March 15 bar is engulfing and bearish, it is with light volumes. At the same time, the primary trend is bullish, defined by gains from November to February 2023. To illustrate, DASH support at $45 marks the 78.6% Fibonacci retracement level. For buyers to swing back to contention, there must be comprehensive gains above $60. Therefore, conservative traders can wait, aware that gains above $60 may lift DASH towards $75 in the near term.
What to Expect from #DASH?
DASH is technically bullish from a top-down preview despite the 30% drop to spot levels. This preview holds provided prices are above $45 and every correction from February highs is with decreasing volumes.
Resistance level to watch out for: $60
Support level to watch out for: $45
Disclaimer: Opinions expressed are not investment advice. Do your research.


DASH: What Do You Need to Know From a Technical Point of View?DASH: What Do You Need to Know From a Technical Point of View?
DASH performed very well during the previous months and as you can see already tested old price zones in a short period of time.
I have explained the possible trading scenarios.
You can watch the video analysis for more details!
thanks and good luck!


DASHUSDT | BULLS BACK?DASH has been trading in a bullish trend .
The price has been side lined and trading in a range from last 2 weeks.
The price has broken below the range but it bounce back quickly and reclaim the support area .
Now it has also broken above the falling resistance.
As long as price is above support zone it may target the higher side of range.
Any break above range will give full strength to bulls.
Manage your trades accordingly.
