DCRBTC trade ideas


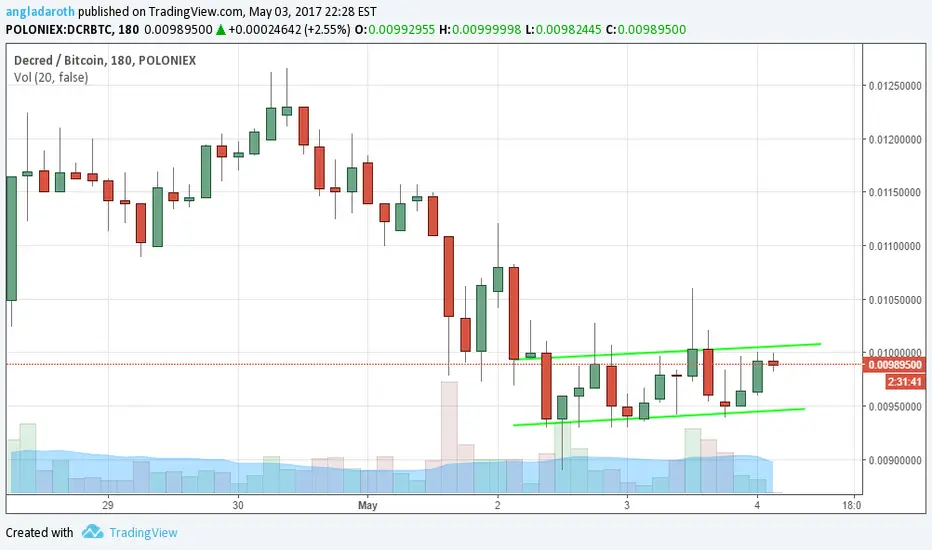
DCR/BTC Triangle pattern break out.It appears that it is bouncing off of this triangle pattern and testing resistance. There are two entries - entry 1 and entry 2.
The placement for entry one is at the support incase the price decides to be tricky before the potential break out.
Entry 2 is the text book entry - The break of resistance.
I take the idea of having a mental stop loss extremely serious.

DCR/BTCIt is possibly at its bottom. The Elliot wave count is at 4 right now while the stochastic gave a bullish signal.

DCRBTC incoming uptrendWe can see a head & shoulders pattern what usually means that an upward trend is ending but in in this case i believe it means the end of a downtrend. DCR has been going down for some days before it reached this pattern and its still going a bit downtrend. I believe that it will stagnate a bit but will be going up soon so its good for a long. I estimate +/- a month before it reaches 0.0150.
Feedback is always welcome! :)

Decred Hunt Volatility Funnel (HVF)?Volatility decreasing/squeezing for over a month. Symmetry looks good. Average true range at similar levels as just before previous major bout of volatility.
4.98 risk reward. Use proper position sizing!
Note that this is a fairly low liquidity coin.

DCRgo long in green box, targets in red box and price callouts. time catalysts denoted in pink. control stop loss via position size or cut at 750k satoshis.


DCR Long oppourtunityGood risk reward with all other alt coins pumping, DCRBTC has been left behind.
I have drawn a bearish ABCD pattern, we are at C now, so expect this to rise from here.
Will go long with tight stop.


Probably a new Island of stability for a whileI doubt it will drop a lot for the next days.It may even grow.
The Secret Decred Tunnels revealedok so they're glaringly obvious
clear upward trend maintained for well over a month. it is passing through the lower side of a resistence cloud so probably not getting to far from home tonight


Is nowhere do fall anymore... DCRBTC I think now all who want to do money from release 1.0.0 is go out from DCTBTC. We see small correction.
So... I waiting for far far 0.017 ...


DCRBTC -> 0.017 soonDCRBTC can fall a bit ... but you can see how it grows early: 0.011 -> 0.013 -> 0.015
...our next target is 0.017!
#DCR #DCRBTC

DCRBTC -> 0.017 soonHey! :)
Looks at my TA DCRBTC - trend direction is simple ...higher and higher.
0.011 ...0.013 ...0.015 ... and ofc 0.017 will be soon. Just wait a bit!

DCR: HEX OR NOClearly we are seeing here a strong classic cubic growth attempting to transition into hexagonal matrix here. Makes sense - Decred's technological superiorness is fitting to the most optimal geometric structure - but does it have what it takes to transform into the hex? I'm not so sure just yet.
Today DCR release v1.0. Lots of tech stuff coming out that are enough to give any crypto addict middle of the night blanket lifting wood. Hard fork voting. Boom. A stakeholder-directed DAO. Boom. Decentralized control of development funds. Boom. Okay, I'm just copying and pasting now, but you get the idea. Great tech stuff. You can read their media which all their holders are going to do whatever they can to make sure you hear about it today.
The question I ask is: so what?
What's the story? What's the thing I can get behind and feel some connection to? I got technology saturation going on in my world. Tech everywhere. Updates throwing themselves at me at every corner I turn. So what?
Fundamentally and technologically, DCR has those things mastered and that is great. But culturally? Emotionally? I need to hear much more than just some ambition and willingness to do anything to be a top 5 coin. You guys want to be rich? How inspiring, where do I sign?
As you can see, there's a dark shadow there looming behind the first cube. Then above there is a hexagonal opening. All the people attached to DCR hope it will go to the next level and upgrade to hex growth, but I don't see that happening. Rolling out new tech advances constantly is wearing very thin and the competition at the top is strong. You think they are there just because of tech? Great tech is maybe 1/3rd of the battle. Litecoin doesn't need to be better tech to continue dominating something like Decred because it has a story. It's little brother. It's the silver to the gold. Human, relatable stuff.
The big wave of mass adoption is coming - if your features list requires you to be born inside the internet and up to date with inner workings of PoS and Hardforking and whatever other things you come up with designed to give the 1% of the 1% of the elite developers community wood, you're going to struggle to be in top 50, let alone top 5.
Maybe go long, but I wouldn't expect more than cubic channel continuing until the next time a swarm forms. Personally, for now I'm sitting this one out. But I was asked to chart this by someone from Decred so that's it from me.
