dentusdtdentusdt is on support on tringle. .btc formed bullish divergence on daily .it looks good here.
DENTUSDT trade ideas

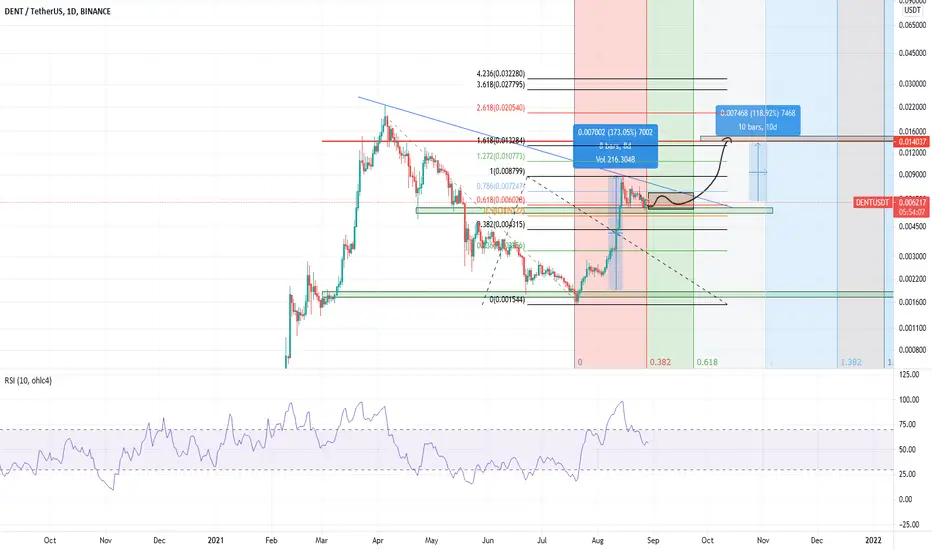
DENT TARGEThello
this is my dent target
if we manged to close above this triangle pattern you can see the target in the chart
and if we close below it also you can see the target in the chart
not financial advice

$DENT breakout?Stochastic is looking strong, building higher lows for the last 3 weeks while in accumulation mode at around $0.0063. Expecting some kind of breakout here over the next day or two to the weekly R1 ($0.0073). Unsure where it will go from there but historically it would reject and accumulate again before finding a new local high.
I don't expect we'll keep ranging in the $0.0061 - $0.0072 area for much longer but while we do there are opportunities. This is a significant range historically. Over the next week or two, we might be looking at $0.0085 around the weekly R3 but it's also possible price action trends towards the $0.0093 mark which is not only the recent high in this cycle but also an area of significance looking back to March through April. That area is right in the golden pocket so depending on what $BTC does I think we might see some ranging in that are for a while if we get there.
As an indicator of movement in the right direction I'll be watching for the daily stochastic to cross over and a daily close above the $0.0065 mark.


DENTUSDT - Can Move 60% Higher ⚠️Dent on the weekly chart with a possible bullflag ! If you zoom in to the daily chart you can see a falling wedge pattern.
IF this break bull and we change the daily trend then we know that the weekly higher low is set!
Keep in mind that my last ideas about weekly charts are good for swing traders and not for scalpers or day traders.
Just want to give some perspective about where we are in the market on the higher time frames.
Thanks for taking your time to check out my idea 😎😎! Often, my ideas are fast gone from the front page because there are so many ideas on the platform and the algo picks the one with more likes 🤖🤖. I think once I have around 20 likes/idea my idea will be shown in front 🥳🥳. It would be awesome if you could like my idea, (only if you really like it of course) 🤪! I believe that the more we can interact with each other, and share thought about an idea, the more we can learn! 👩🏫🧑🏾🏫👨🏻🏫
Furthermore, I made a challenge for myself, I will add 1 idea for every new follower🦹♀️ So if I have 1 follower each day, I will add 1 idea. If I have 10 followers, I will add 10 🏌️♂️ It’s fun for me and you! More followers = more ideas = powerful community! 💪💪💪 Besides, all the ideas are … FREE 🥳🥳🥳
⚠️⚠️ If you want to know how my previous ideas played out, > push the play button on my previous ideas and check it out 🕵️🕵️
Is there a ticker you want me to look into? Let me know in the comments below ⬇️⬇️⬇️

DENT/USDT Bull OR BearBTC is tired and below resistance line in 48700
I like to know your idea about it just comment below and let me hear you...

dent
Now we are in the process of collecting in the 0.618 Fibonacci area after the assembly process we will start
T1 0.008
T2 0.014
T3 0.023


DENT USDTLet´s go DENT USDT to the moon ? :)
! not financial advice. Please comment on your opinion.

DENTUSDT AnalysisWe are getting one EngineeringRobo Sell signal and waiting to see what happens at 8pmEST to determine our next move. Another Sell signal means we are Selling all of our DENT. Wait for next opportunity to BUY. Even if you are not Selling all of them, we are selling more than 50%.


DENT USDT See my chart to understand the futureI'm not going to sell Dent
I're just going to collect the dent at different price levels and wait until Christmas
Santa's been rewarding me for that
This is just my idea
Your own risk
Do not forget to like and comment

DENTUSDT - 1D - UPDATE...see and watch :)
The red range has had good support for the price and we seem to be able to take an upward step to the next resistance range ...

Dent Long target 0.0088$ The best looking chart out there , looks bullish , lets see what dent brings on.


DENTUSDT🌟this alt has a great potential to shine in the bullish runs and that comes with a high ATR ratio so be ready to put a portion of your whole basket into this alt
🌟for now this alt become sideway and waiting for a motivation (it might lose some value too but don't panic its so far from our stop loss)
👉This idea has the confirmation of "advanced price action" 👍
👉Follow us and invite your friends too, this way we can share ideas and signal to anyone we care 👍
👉Hit share and spread the information in public chats or your twitter for everybody to get profit 👍
👉Tell us what's important for you in the market or what asset makes a difference in your investment basket 👍


‼️Watch $DENT how it holds the sit movement to continue UP.Dent did a rejection holding the previous breakout line so it headed to previous support, which is trying to hold now and it's doing quite a good job. Altough we must be watching this level either if it holds or looses, to take corresponding actions.


DENT updateMarket Cap $721,654,714
24 Hour Trading Vol $123,950,709
Circulating Supply 95,654,960,452
Total Supply 100,000,000,000

INVERSE HEAD AND SHOULDERS PATTERN - DENT/USDT REVIEW 📚Good day everyone.
Today, I'll be discussing the inverse (inverted) head and shoulders reversal pattern.
1. DEFINITION
What is Inverse Head And Shoulders?
An inverse head and shoulders , also called a "head and shoulders bottom", is similar to the standard head and shoulders pattern, but inverted: with the head and shoulders top used to predict reversals in downtrends. This pattern is identified when the price action of a security meets the following characteristics: the price falls to a trough and then rises; the price falls below the former trough and then rises again; finally, the price falls again but not as far as the second trough. Once the final trough is made, the price heads upward, toward the resistance found near the top of the previous troughs.
2. ENTRY
The entry (buy order) of an inverse head and shoulders pattern can be of three types:
- Market entry: current market price.
- Stop limit entry: breakout above the inverse head and shoulders neckline resistance.
- Limit entry: Retest of the right shoulder's horizontal support level.
3. TARGET (TAKE PROFIT)
The target level of your inverse head and shoulders pattern should be the key trend based fibonacci extension zone (1 - 1.272 - 1.414).
4. SETUP INVALIDATION AND STOP LOSS
The setup invalidation of this setup is a breakdown below the shoulders support level.
The stop loss can be less than or equal to the setup invalidation.
TRADE EXAMPLE
I'll be using my analysis on DENT/USDT {DENT} as a trade example on the inverse head and shoulders reversal pattern.
My entry (buy order) ⬆️: breakout above the neckline resistance.
My target 🎯: the key trend based fibonacci extension zone (1 - 1.272 - 1.414).
Setup invalidation ❌: breakdown below the shoulders support level.
Stop loss 🔴: breakdown below the shoulders support level.
The trade played out as expected, hitting my take profit and it's still pumping.
